Fig. 9
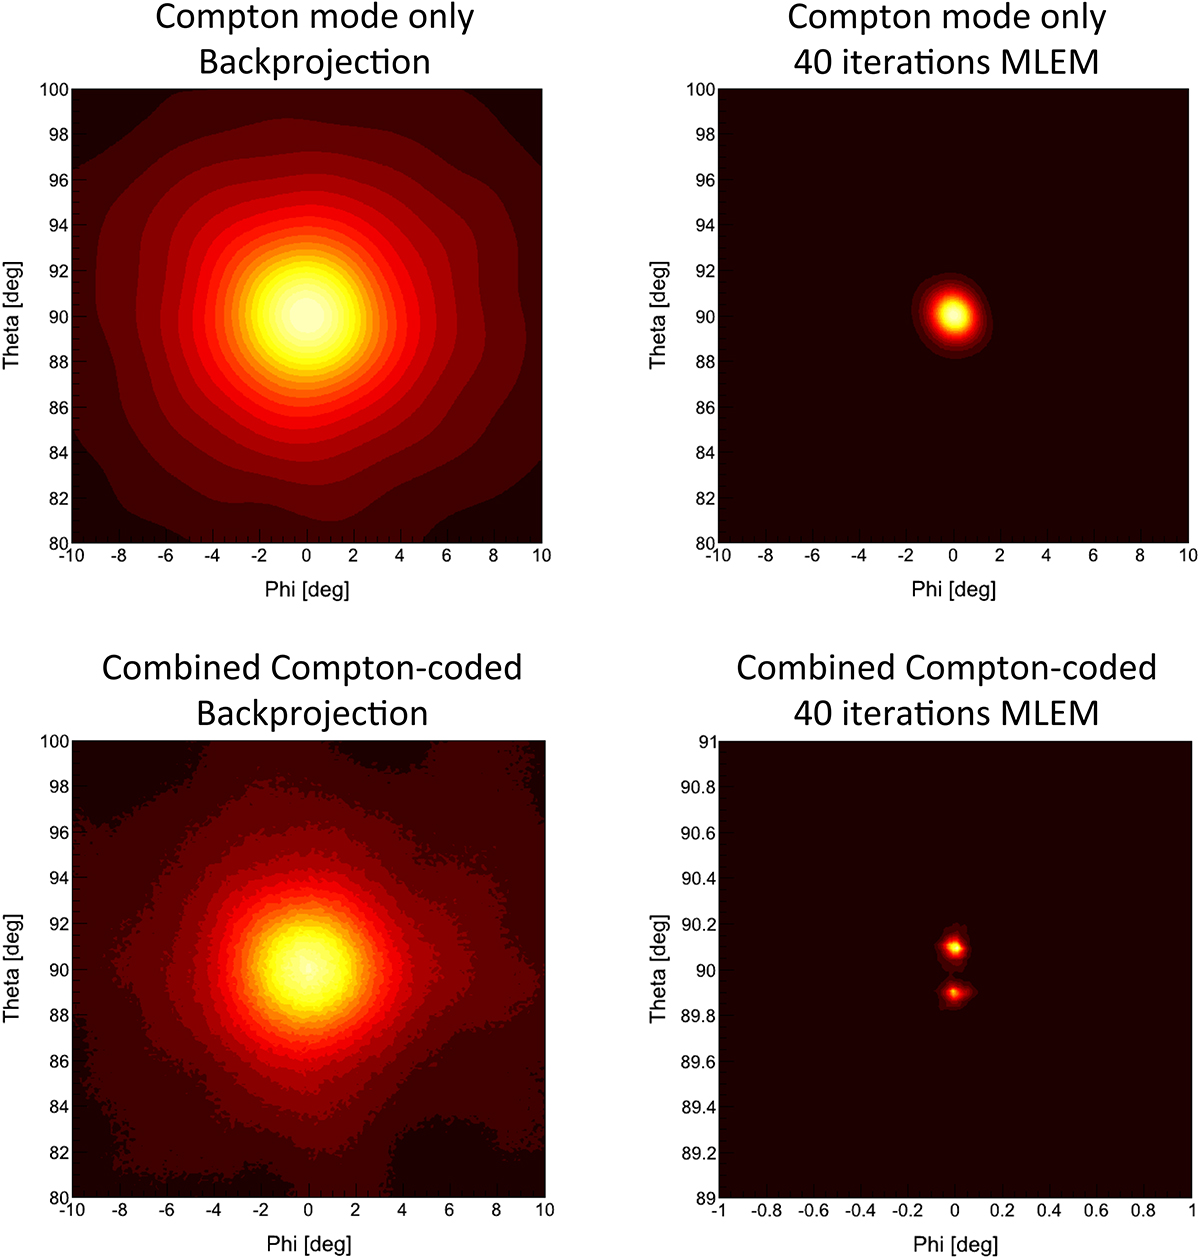
Imaging of two sources separated by 0.2°. Top left: back projection in Compton mode alone. Bottom left: back projection with combined Compton-coded mask mode. Top right: deconvolved image after 40 iterations in Compton mode alone. Bottom right: combined Compton and coded-mask mode image after 40 iterations. Note the change in scale between the bottom two images.
Current usage metrics show cumulative count of Article Views (full-text article views including HTML views, PDF and ePub downloads, according to the available data) and Abstracts Views on Vision4Press platform.
Data correspond to usage on the plateform after 2015. The current usage metrics is available 48-96 hours after online publication and is updated daily on week days.
Initial download of the metrics may take a while.