Fig. 9
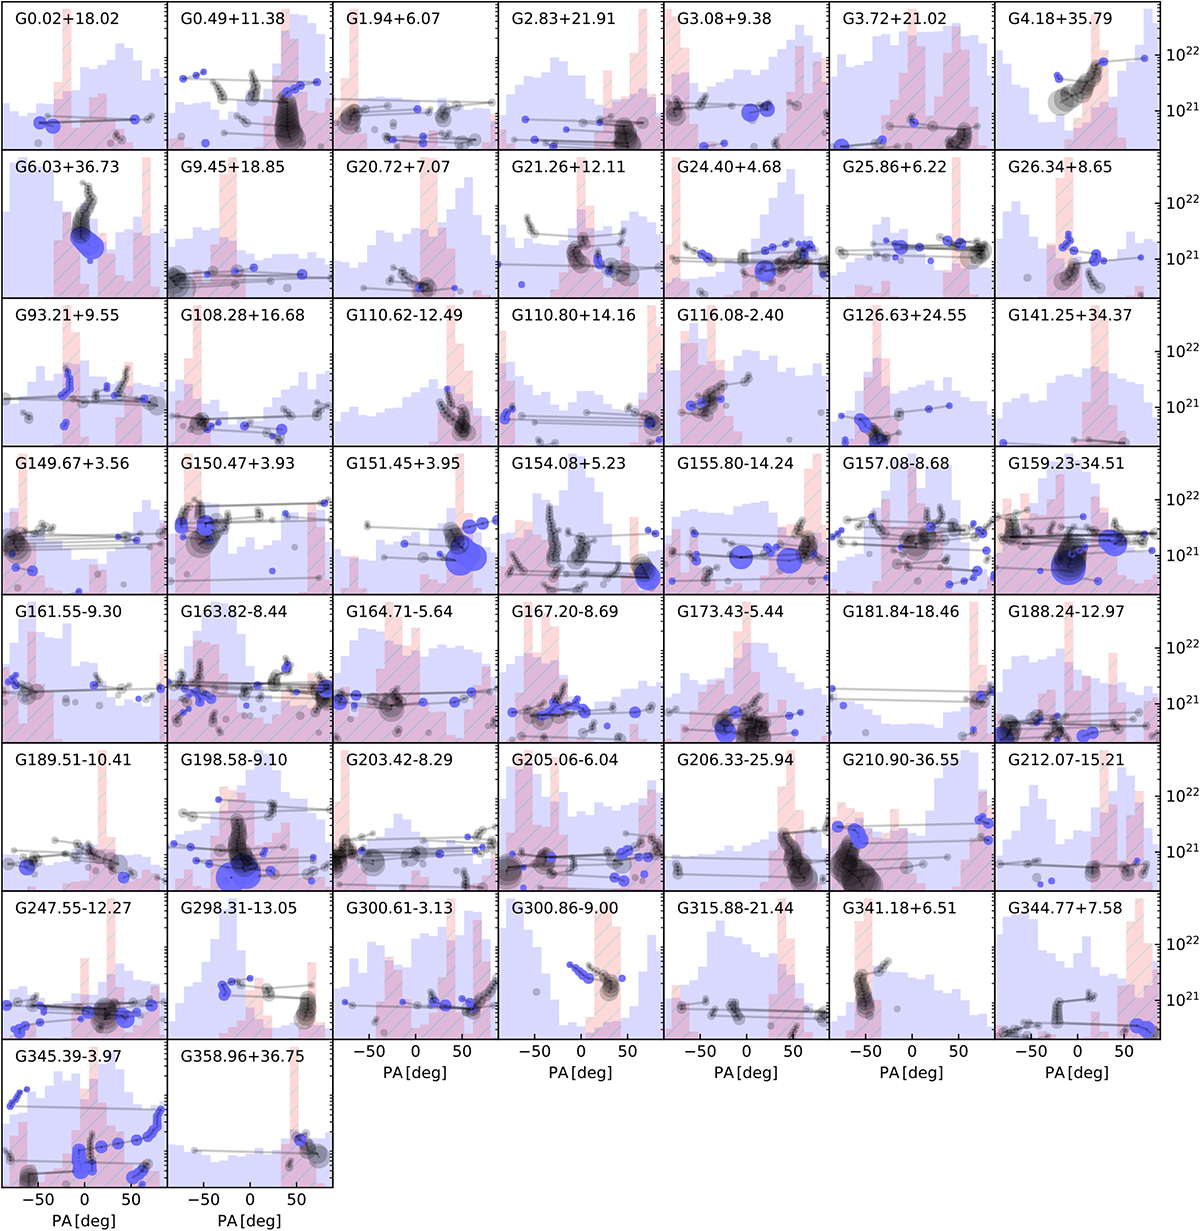
Orientation of structures in the 51 analysed fields. The histograms show the distribution of position angles from the TM analysis with FWHM = 0.6′ (blue histogram) and FWHM = 5.0′ (red hatched histograms). The histogram normalisation is arbitrary. The circles show the position angles of the clumps at different column density thresholds (right hand axis, in units of H2 column density cm−2). The black and blue symbols are partly transparent and correspond, respectively, to clumps with aspect ratios above and below the value of 1.5. Lines connect clumps to the parent clumps at lower column density levels. The radius of the plotted symbols is proportional to the clump area raised to the power of 2/3.
Current usage metrics show cumulative count of Article Views (full-text article views including HTML views, PDF and ePub downloads, according to the available data) and Abstracts Views on Vision4Press platform.
Data correspond to usage on the plateform after 2015. The current usage metrics is available 48-96 hours after online publication and is updated daily on week days.
Initial download of the metrics may take a while.