Fig. 8
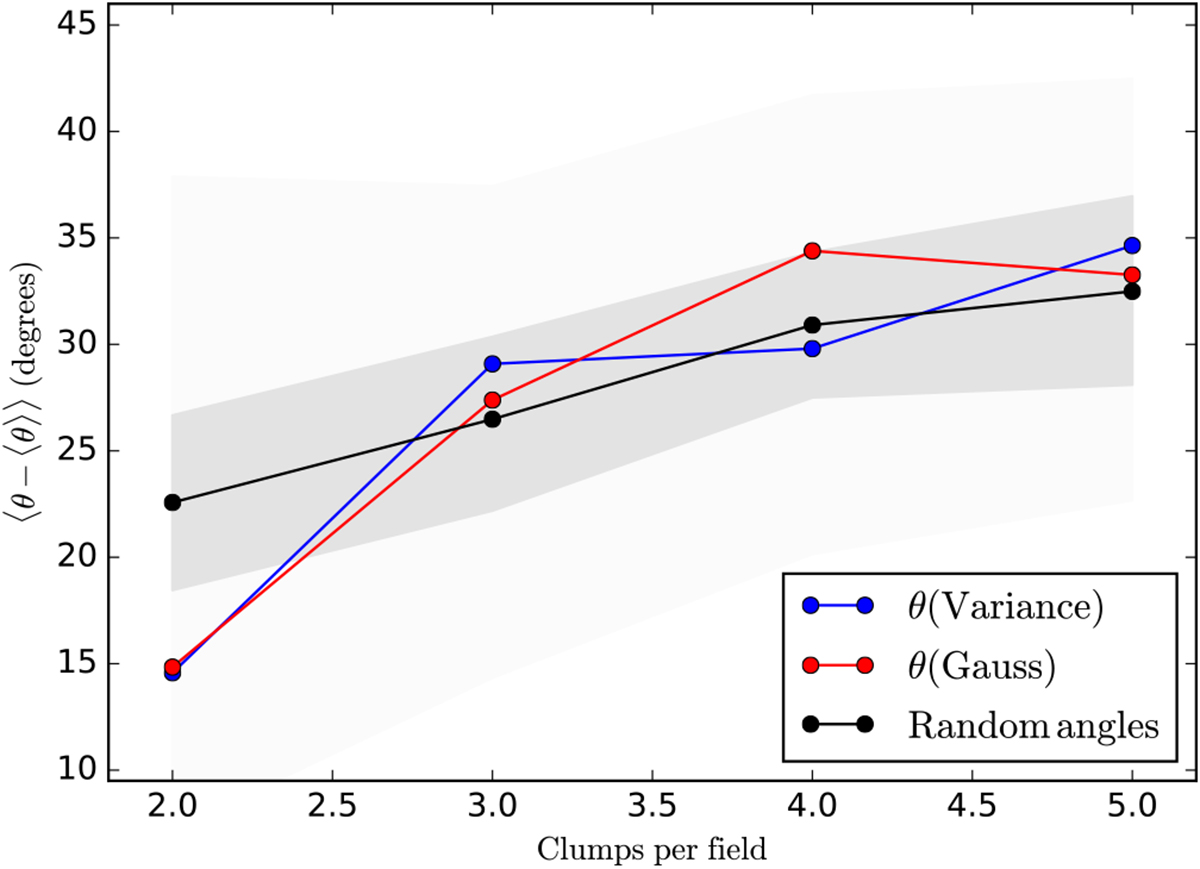
Average difference of the position angles of individual clumps and the average of all clumps in a field. The relation is plotted as a function of the number of clumps in the field, using the directions of maximum variance (blue curve) or the main axis ofthe fitted 2D Gaussians (red curves). The black curve shows the expected relation for a completely random distribution of position angles. The shaded region corresponds to 68% interval for a single field and the dark shaded region to the 68% interval for the average, taking into account the number of fields with the given number of clumps.
Current usage metrics show cumulative count of Article Views (full-text article views including HTML views, PDF and ePub downloads, according to the available data) and Abstracts Views on Vision4Press platform.
Data correspond to usage on the plateform after 2015. The current usage metrics is available 48-96 hours after online publication and is updated daily on week days.
Initial download of the metrics may take a while.