Free Access
Fig. 7
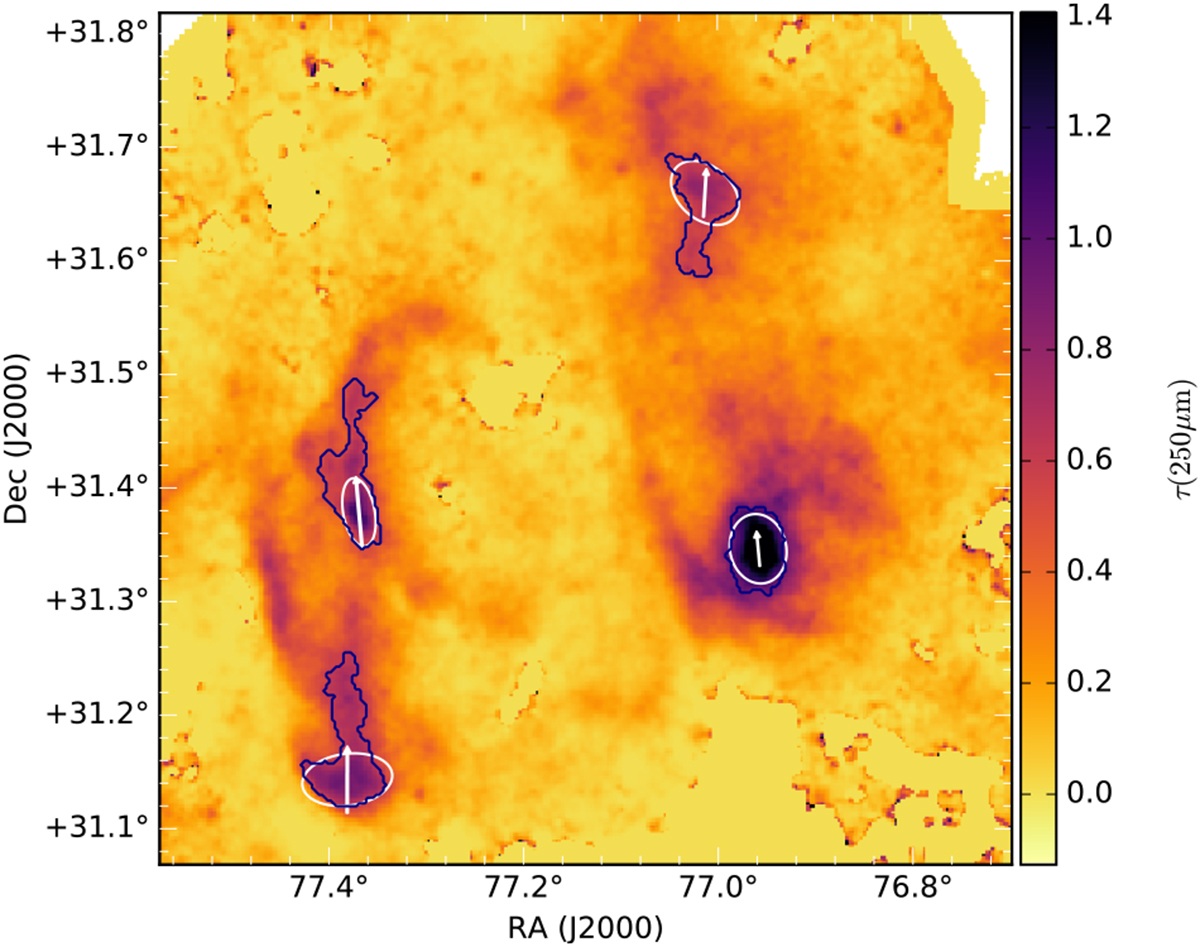
Clump orientations in the field G173.43–5.44. The black contours correspond to the boundaries of the selected structures. The arrows show the direction of maximum variance, with positive skewness along the arrow direction, and the ellipses show the orientation of the fitted 2D Gaussians.
Current usage metrics show cumulative count of Article Views (full-text article views including HTML views, PDF and ePub downloads, according to the available data) and Abstracts Views on Vision4Press platform.
Data correspond to usage on the plateform after 2015. The current usage metrics is available 48-96 hours after online publication and is updated daily on week days.
Initial download of the metrics may take a while.