Free Access
Fig. 6
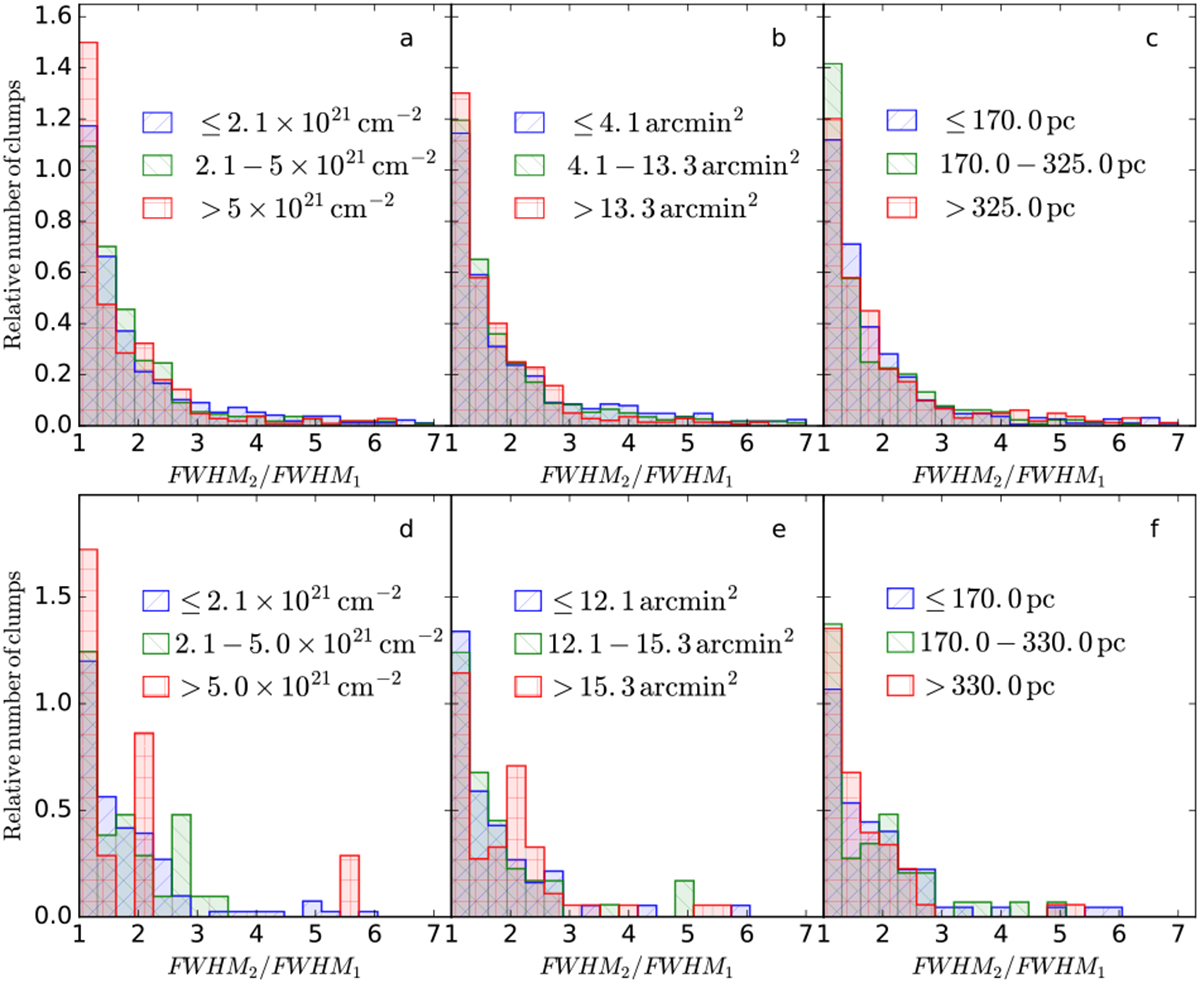
Aspect ratios of the fitted 2D Gaussians. The different histograms correspond to different ranges of column density (frame a), clump area (frame b), and field distance (frame c), as indicated in the frames. The lower frames d-f show the same data for a subset of clumps with areas of 10 arcmin2.
Current usage metrics show cumulative count of Article Views (full-text article views including HTML views, PDF and ePub downloads, according to the available data) and Abstracts Views on Vision4Press platform.
Data correspond to usage on the plateform after 2015. The current usage metrics is available 48-96 hours after online publication and is updated daily on week days.
Initial download of the metrics may take a while.