Free Access
Fig. 5
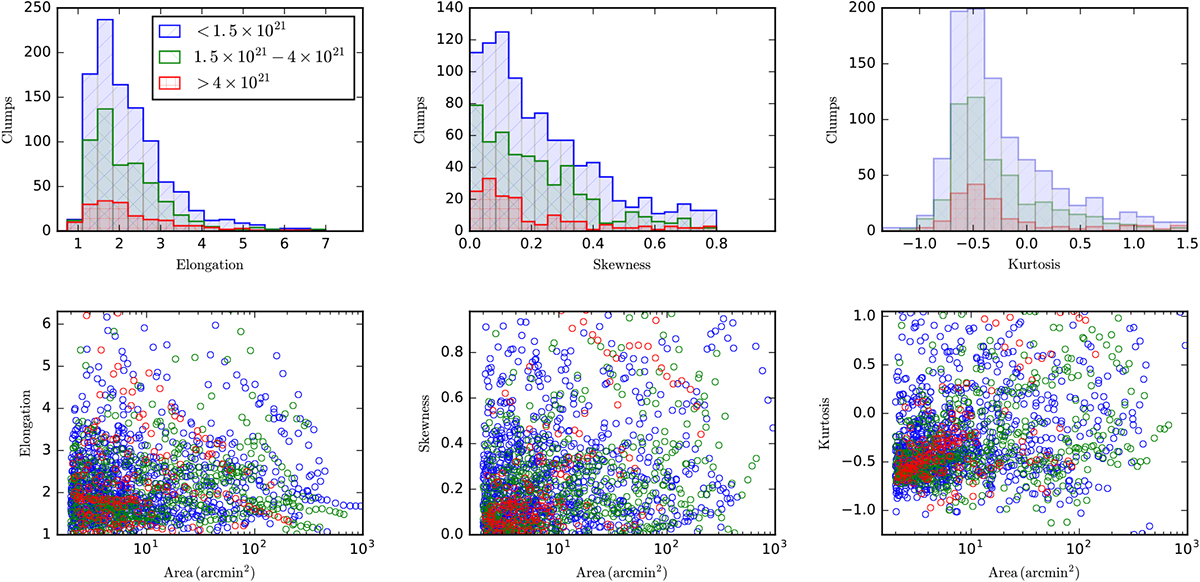
Basic statistics for selected clumps. The colours blue, green, and red correspond to clumps with mean column density N(H2) < 2.1 × 1021 cm−2, N(H2) = 2.1 − 5.0 × 1021 cm−2, and N(H2) > 5.0 × 1021 cm−2, respectively.In the top row, skewness and excess kurtosis are calculated for the minor axis direction.
Current usage metrics show cumulative count of Article Views (full-text article views including HTML views, PDF and ePub downloads, according to the available data) and Abstracts Views on Vision4Press platform.
Data correspond to usage on the plateform after 2015. The current usage metrics is available 48-96 hours after online publication and is updated daily on week days.
Initial download of the metrics may take a while.