Fig. 4
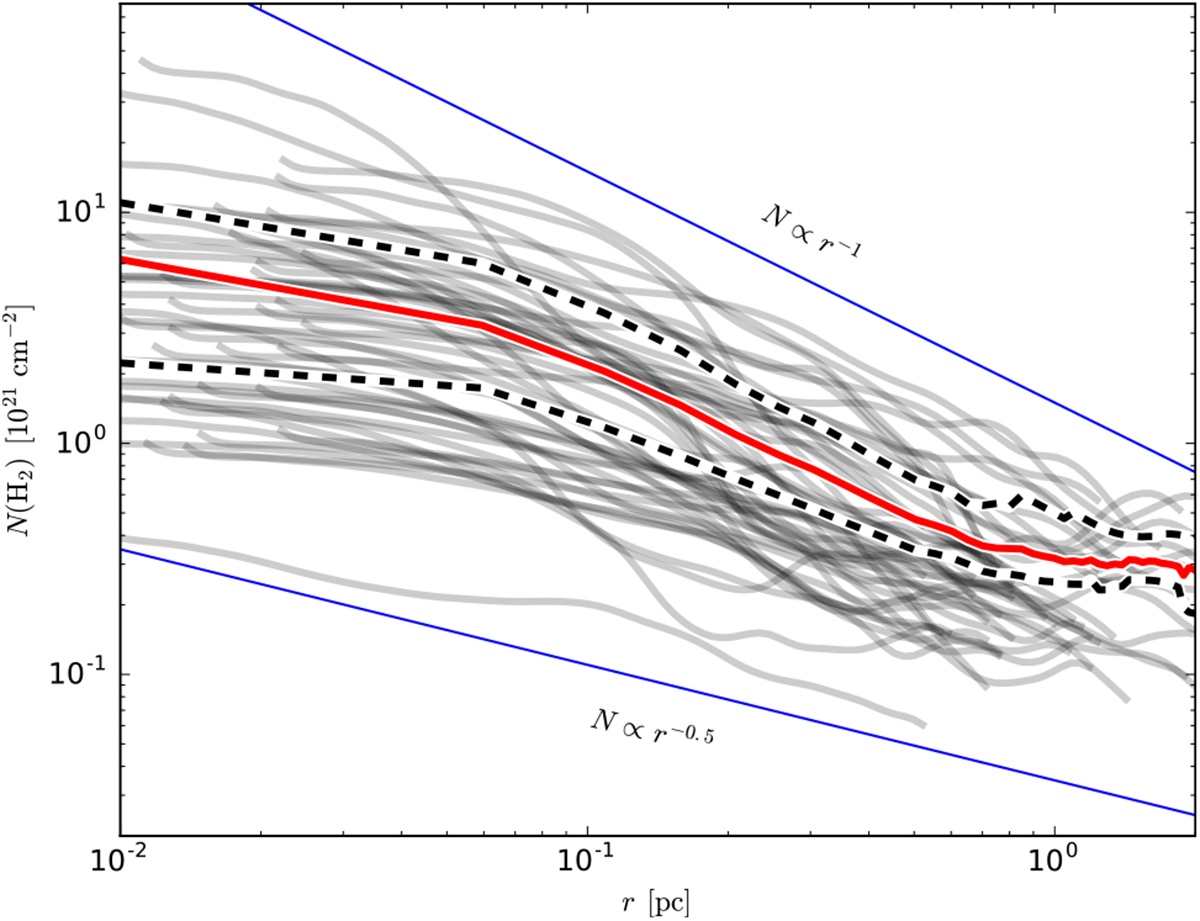
Average column density profiles as a function of the distance from the highest column density peak in each field (grey lines). The thick red line shows the mean column density profile and the dashed lines the average profiles separately for fields with peak column density below or above 5 × 1021 cm−2. For comparison, the solid blue lines show the r−1.0 and r−0.5 relations.
Current usage metrics show cumulative count of Article Views (full-text article views including HTML views, PDF and ePub downloads, according to the available data) and Abstracts Views on Vision4Press platform.
Data correspond to usage on the plateform after 2015. The current usage metrics is available 48-96 hours after online publication and is updated daily on week days.
Initial download of the metrics may take a while.