Fig. 3
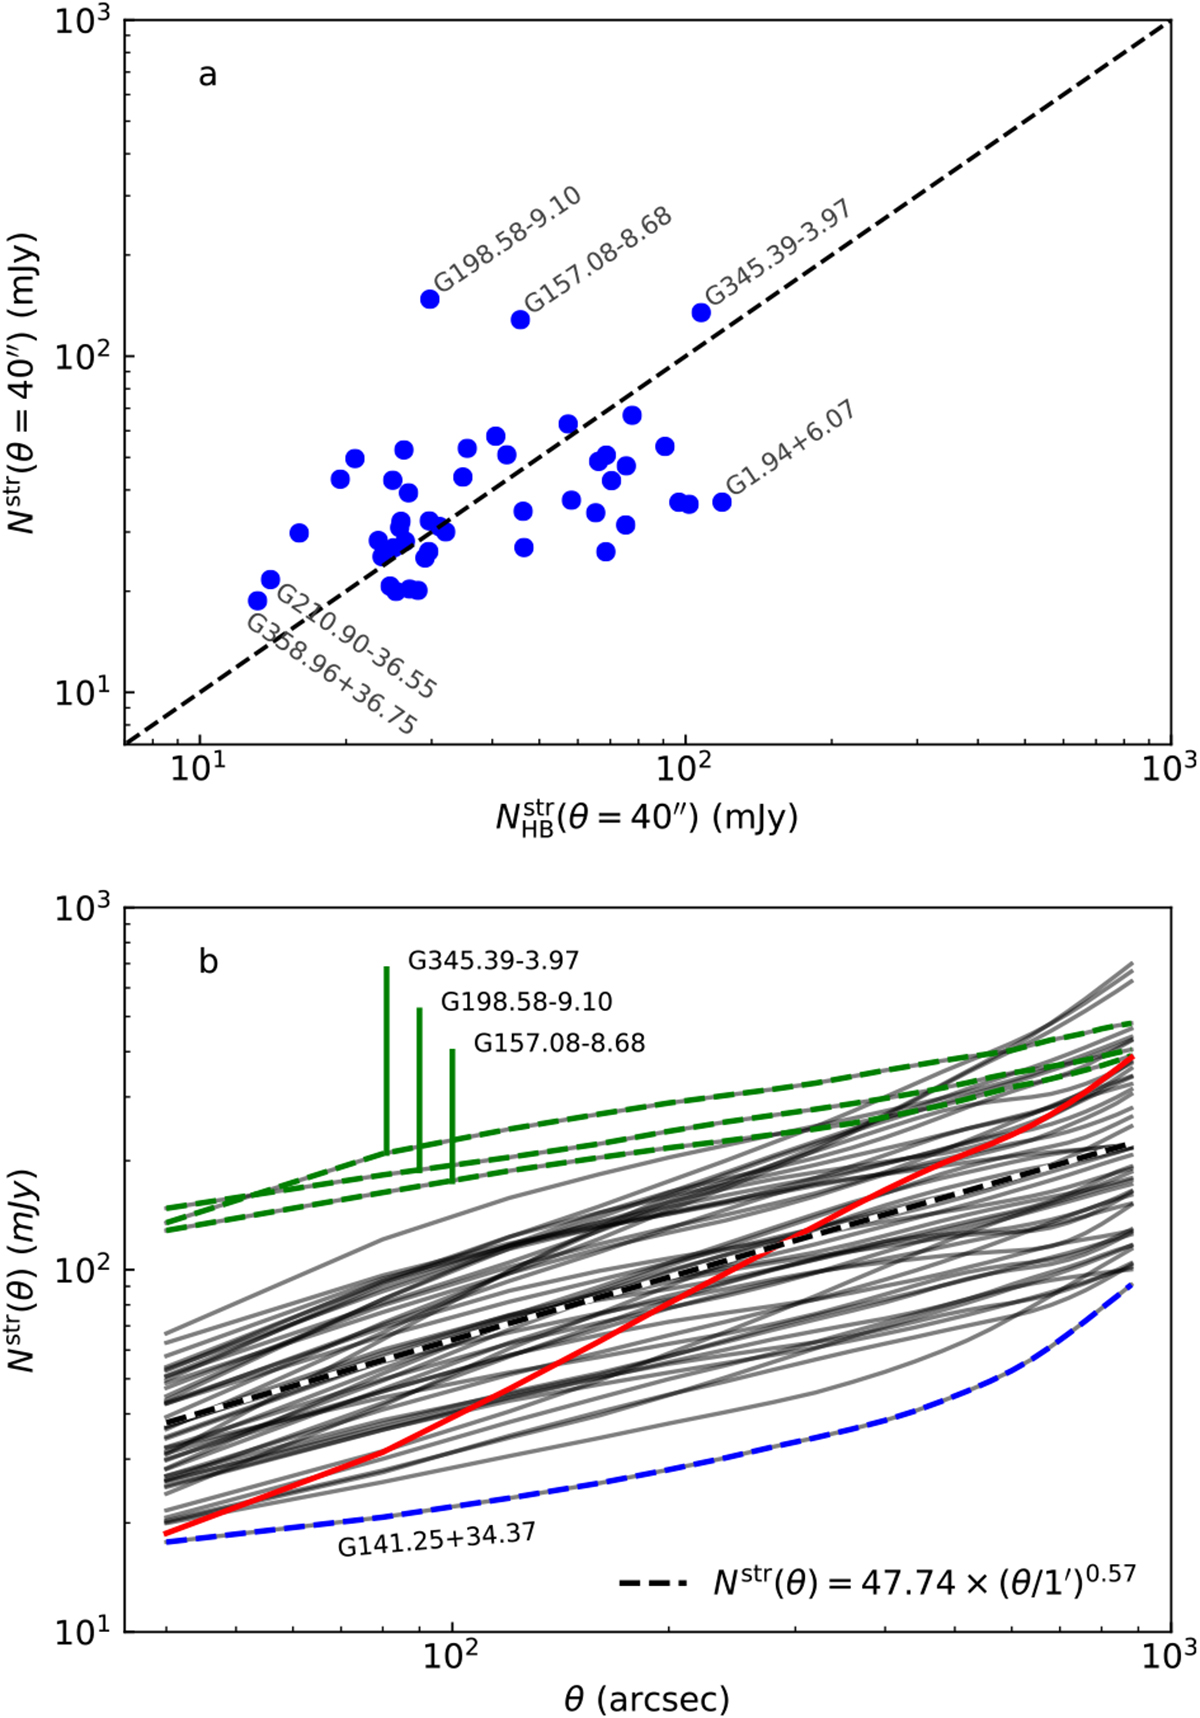
Structure noise Nstr(θ) in selected fields. The upper frame shows Nstr(θ = 40′′) for the 250 μm surface brightness (blue dots), compared to the surface-brightness dependence of Helou & Beichman (1990; dashed line). The lower frame shows Nstr(θ) in individualfields as a function of the angular scale θ. The black dashed line indicates the median relation. The coloured lines highlight particular fields discussed in the text (G141.25+34.37 as the bottom blue dashed line, G358.96+36.75 as the red solid line, and the fields G345.39–3.97, G198.58–9.10, and G157.08–8.68 as the uppermost dashed green lines).
Current usage metrics show cumulative count of Article Views (full-text article views including HTML views, PDF and ePub downloads, according to the available data) and Abstracts Views on Vision4Press platform.
Data correspond to usage on the plateform after 2015. The current usage metrics is available 48-96 hours after online publication and is updated daily on week days.
Initial download of the metrics may take a while.