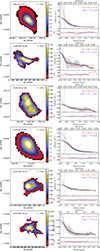
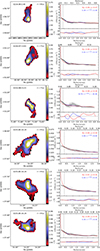
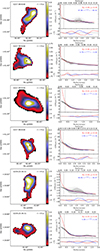
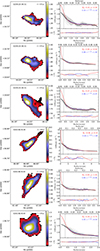
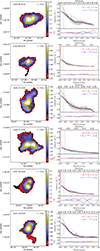
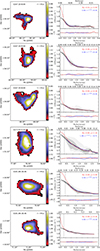
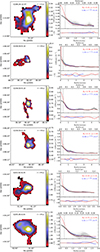
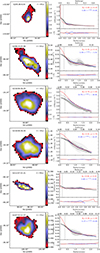
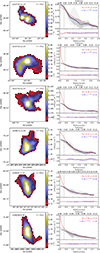
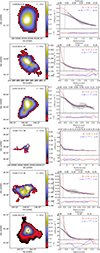
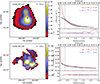
Fig. F.1
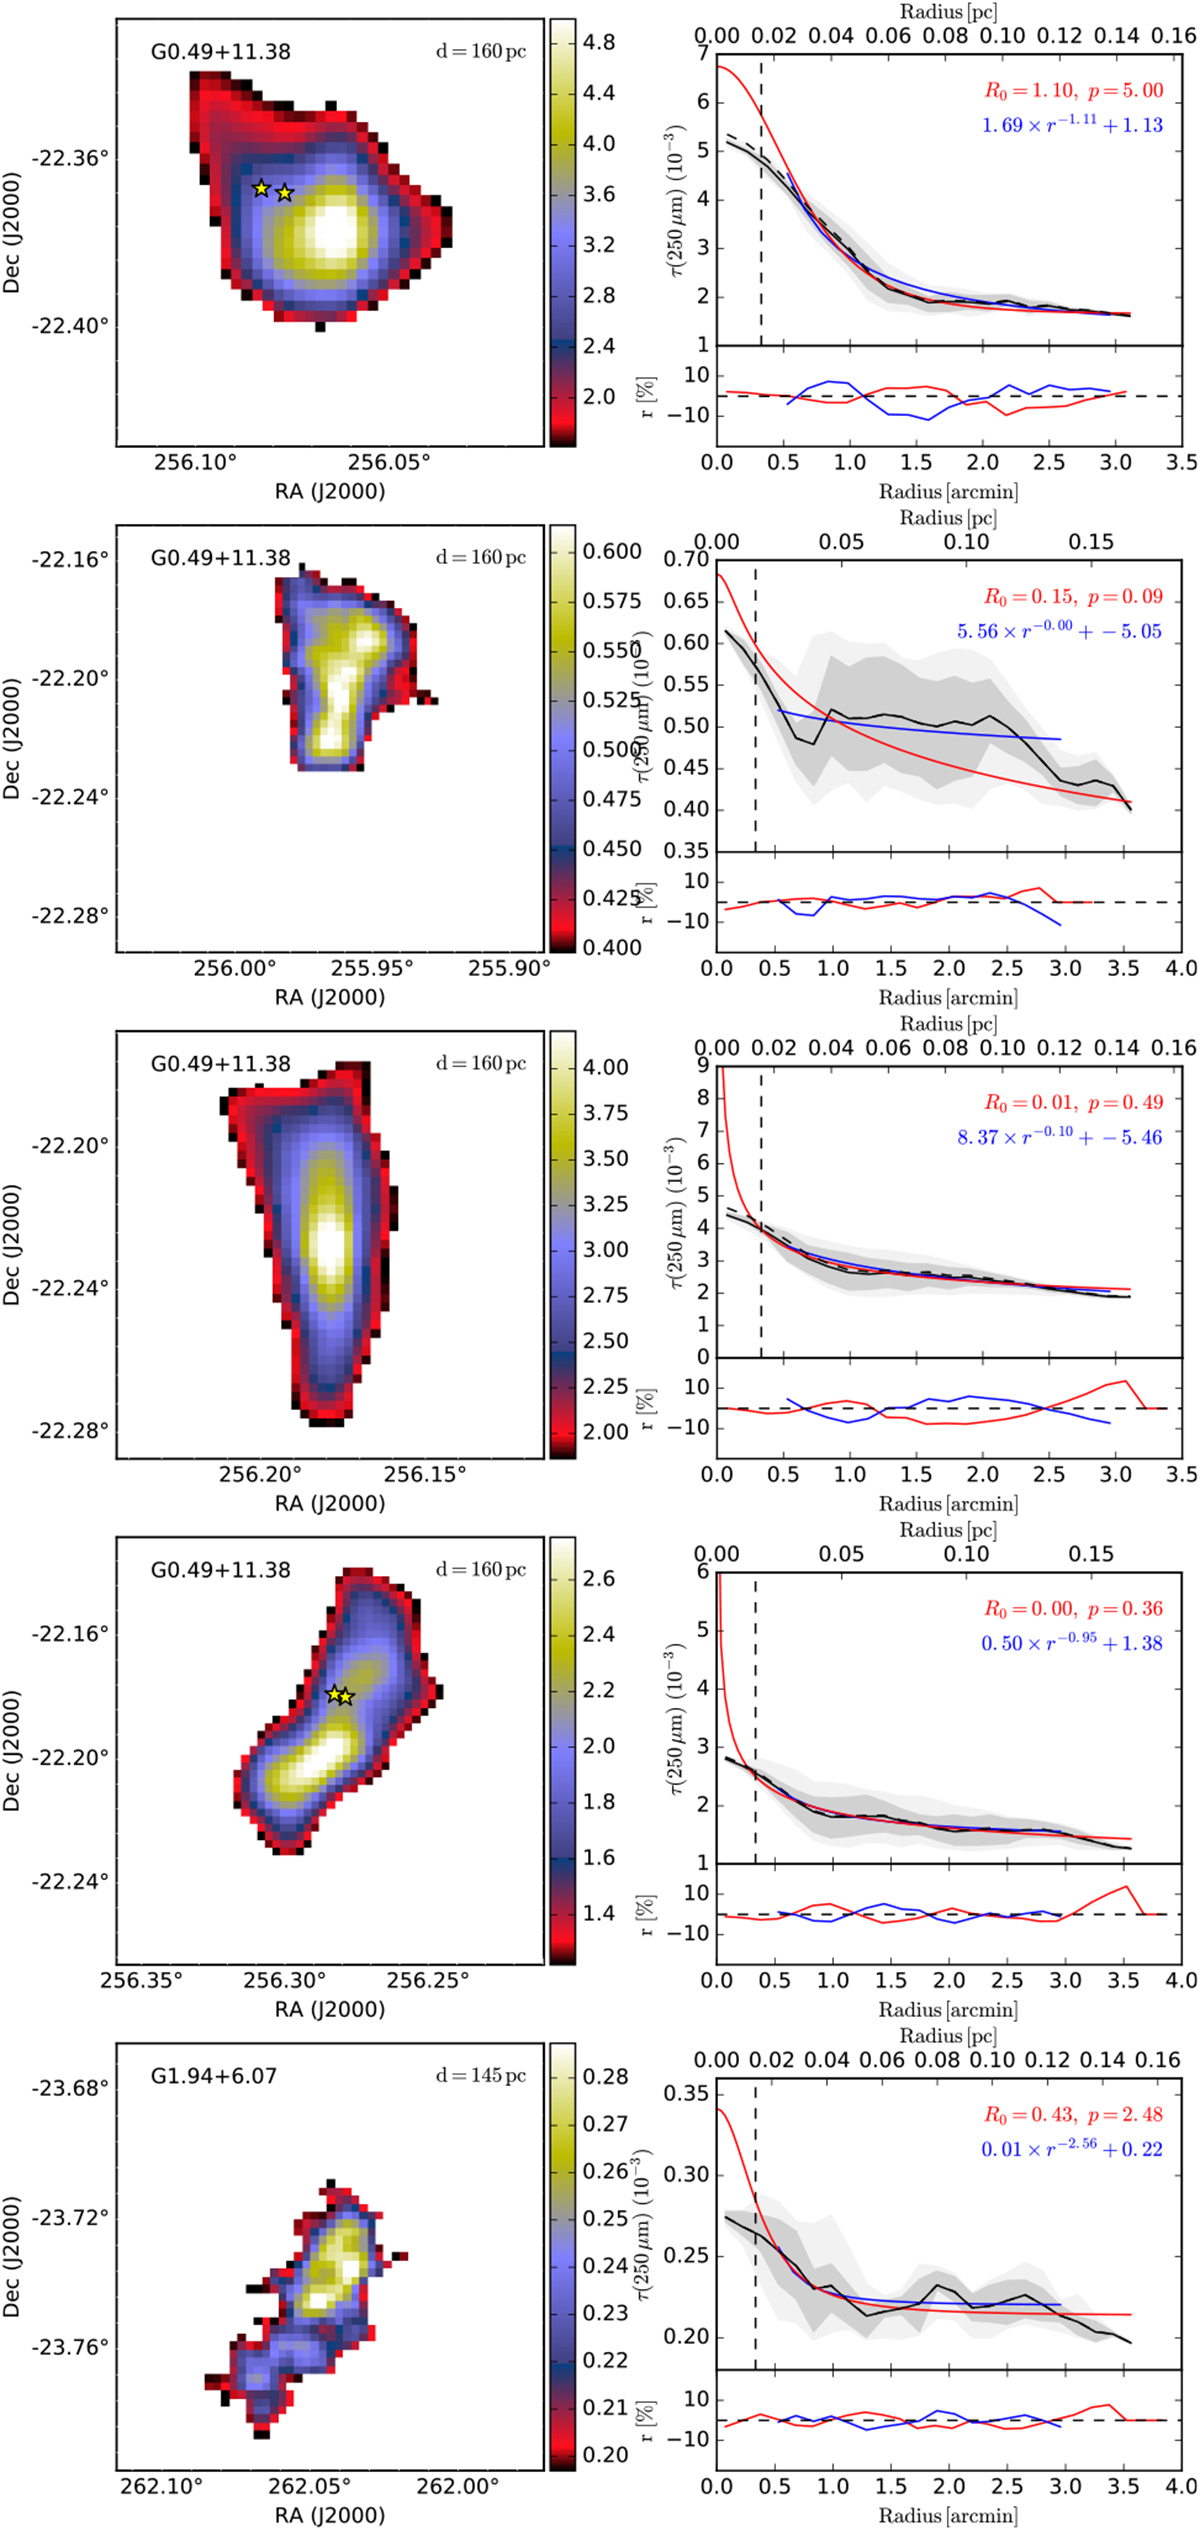
Maps and radial profiles of 10−3 × τ(250μm) for 10 arcmin2 clumps. On the map, YSO candidates (Montillaud et al. 2015) are indicated with stars. On the right, the azimuthal averaged profiles are shown without (black solid line) and with (dashed black line) corrections derived from RT models. The shaded areas show the 10-90% and the 25-75% intervals for the azimuthal variation. The red curve correspond to the fitted, de-convolved Plummer profiles. The blue curve correspond to a powerlaw fit to data outside 30′′ radius (data corrected according to the RT models but not deconvolved). The fit parameters are quoted in the frame. The vertical dashed line at 20′′ corresponds to the FWHM extent of a point source. The lower frame shows the relative fit errors.
Current usage metrics show cumulative count of Article Views (full-text article views including HTML views, PDF and ePub downloads, according to the available data) and Abstracts Views on Vision4Press platform.
Data correspond to usage on the plateform after 2015. The current usage metrics is available 48-96 hours after online publication and is updated daily on week days.
Initial download of the metrics may take a while.