Fig. D.1
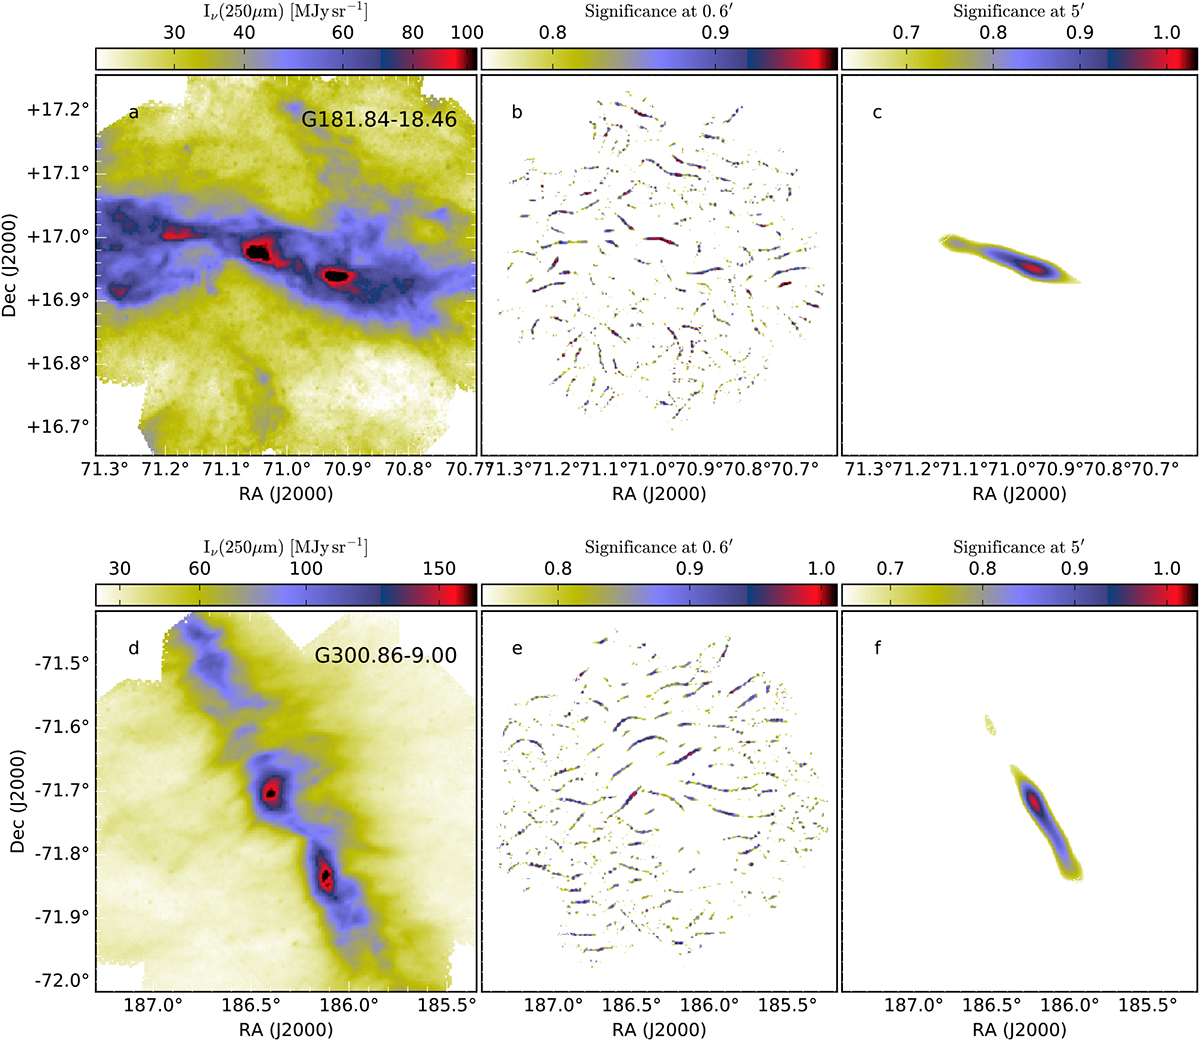
Examples of elongated structures extracted by the TM method. The upper row shows data for the field G181.84-18.46 and the lower row for G300.86-9.00. The frames, from left to right, are the 250 μm surface brightness and the relative significance of the aligned structures at the 0.6′ and 5′ scales. In the latter frames, pixels with relative significance below the 90% percentile are masked.
Current usage metrics show cumulative count of Article Views (full-text article views including HTML views, PDF and ePub downloads, according to the available data) and Abstracts Views on Vision4Press platform.
Data correspond to usage on the plateform after 2015. The current usage metrics is available 48-96 hours after online publication and is updated daily on week days.
Initial download of the metrics may take a while.