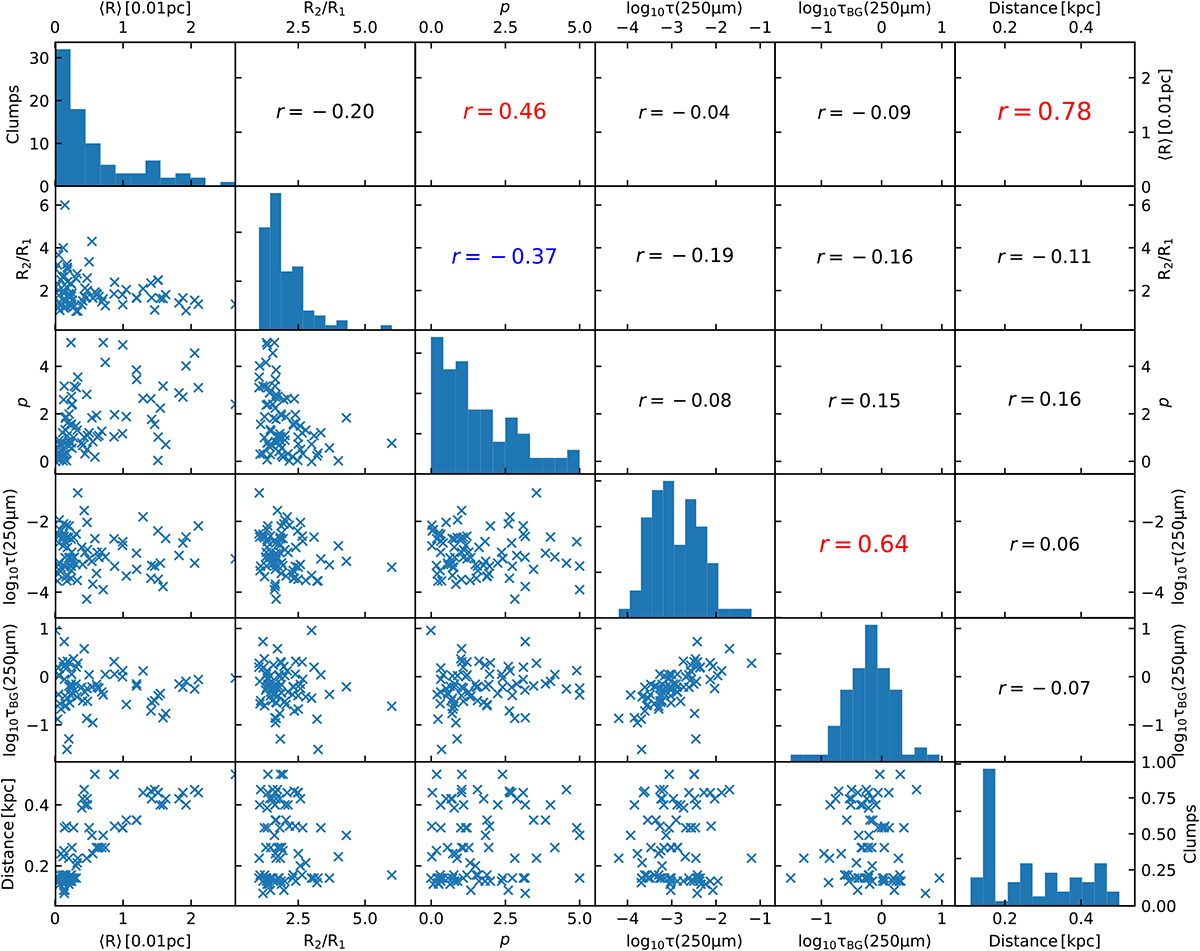
Fig. C.2

Distributions of the parameters of 2D Plummer profiles for the sub-sample of 85 clumps. Scatterplots and correlations are shown between geometric mean of the flat radius values ⟨R⟩, ratio of flat radius values R2∕R1, power-law exponent p, peak optical depth τ(250 μm), background optical depth τBG(250 μm), and distance. The frames on the diagonal show the histograms of the individual quantities and the frames in the upper right hand part of the figure indicate the linear correlation coefficients for the corresponding pairs of parameters.
Current usage metrics show cumulative count of Article Views (full-text article views including HTML views, PDF and ePub downloads, according to the available data) and Abstracts Views on Vision4Press platform.
Data correspond to usage on the plateform after 2015. The current usage metrics is available 48-96 hours after online publication and is updated daily on week days.
Initial download of the metrics may take a while.


