Fig. C.1
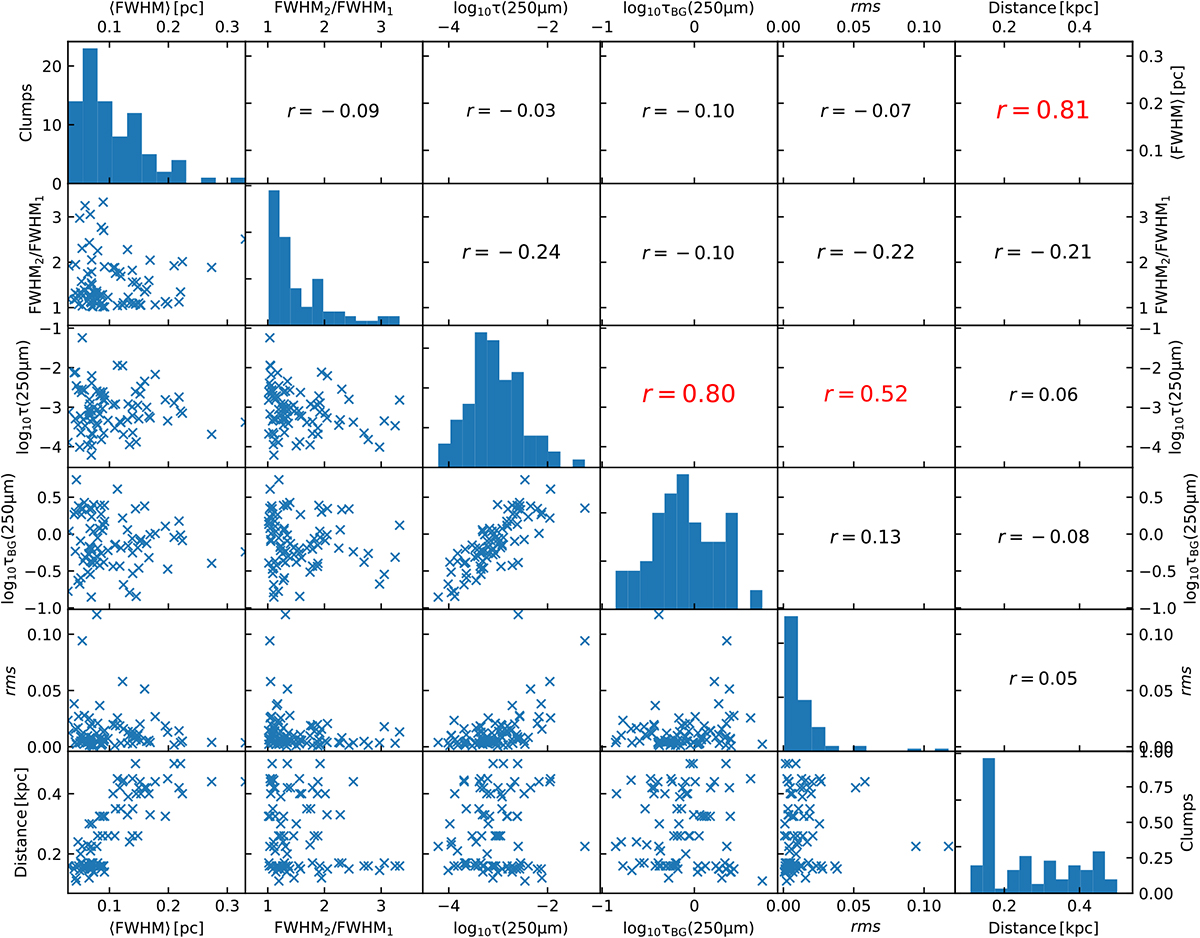
Distributions of the parameters of 2D Gaussian fits to the sub-sample of 85 clumps. The frames in the lower left part of the figure show scatterplots between the quantities: clump size ⟨FWHM⟩, clump elongation FWHM2∕FWHM1, peak optical depth τ(250 μm), background optical depth τBG(250μm), the relative rms error of the fit, and the distance. The frames on the diagonal show the histograms of the individual quantities and each of the remaining frames indicates the linear correlation coefficient between the corresponding pair of parameters.
Current usage metrics show cumulative count of Article Views (full-text article views including HTML views, PDF and ePub downloads, according to the available data) and Abstracts Views on Vision4Press platform.
Data correspond to usage on the plateform after 2015. The current usage metrics is available 48-96 hours after online publication and is updated daily on week days.
Initial download of the metrics may take a while.