Fig. A.1
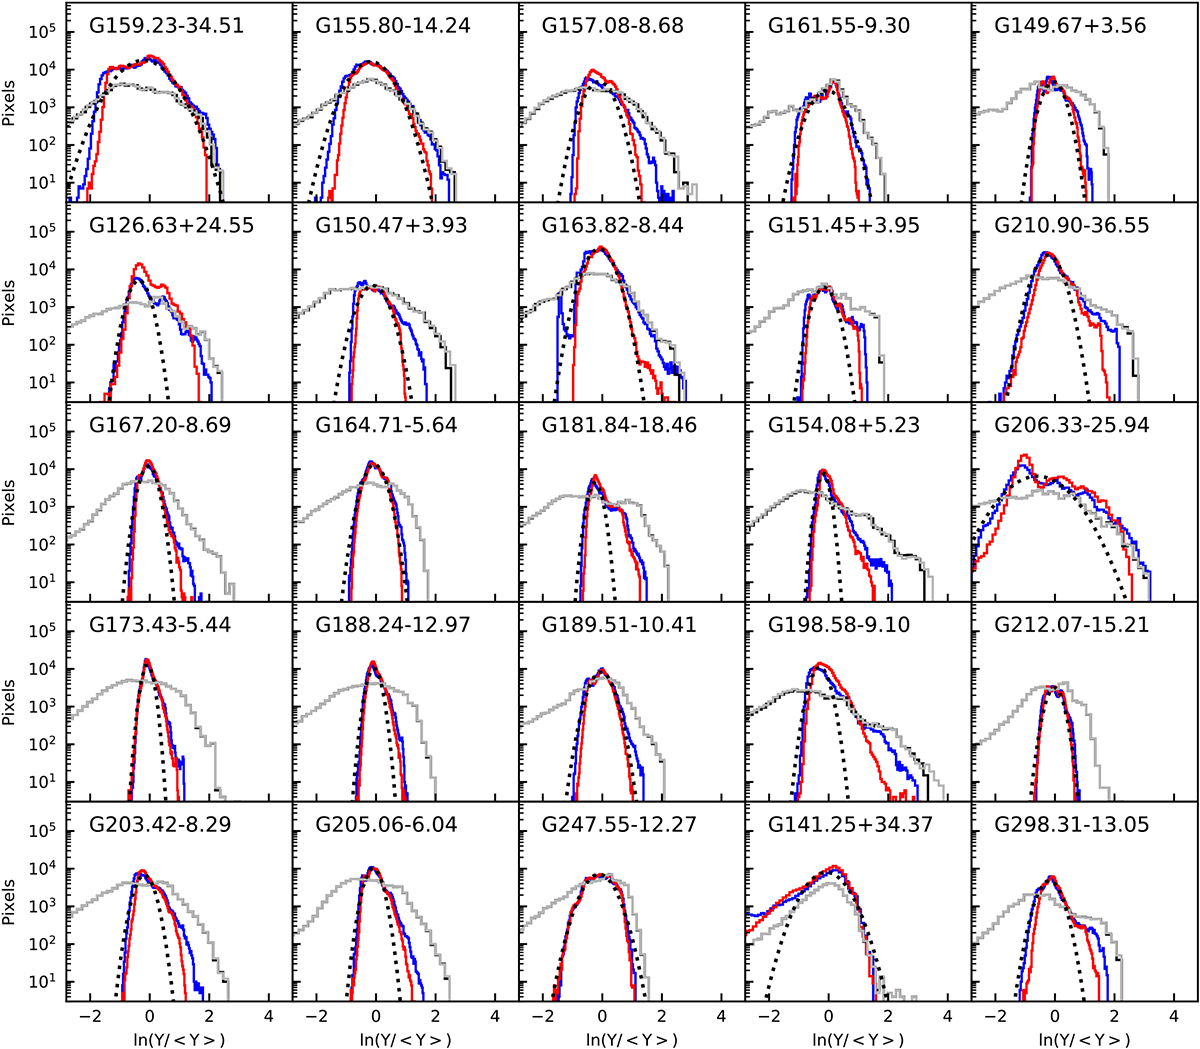
PDFs of the logarithm of the relative values of column density (N∕⟨N⟩); blue lines) and 250μm surface brightness (S(250μm)∕⟨S(250μm)⟩); red lines). Gaussian fits to the column density histograms are shown as dotted black lines. The black histograms are derived from column density that is estimated based on background subtracted surface-brightness data. The grey histograms additionally (mostly on top of the black histograms) include the bias corrections derived from RT models. The fields are arranged in the order of increasing distance (see Table 1).
Current usage metrics show cumulative count of Article Views (full-text article views including HTML views, PDF and ePub downloads, according to the available data) and Abstracts Views on Vision4Press platform.
Data correspond to usage on the plateform after 2015. The current usage metrics is available 48-96 hours after online publication and is updated daily on week days.
Initial download of the metrics may take a while.