Fig. 2
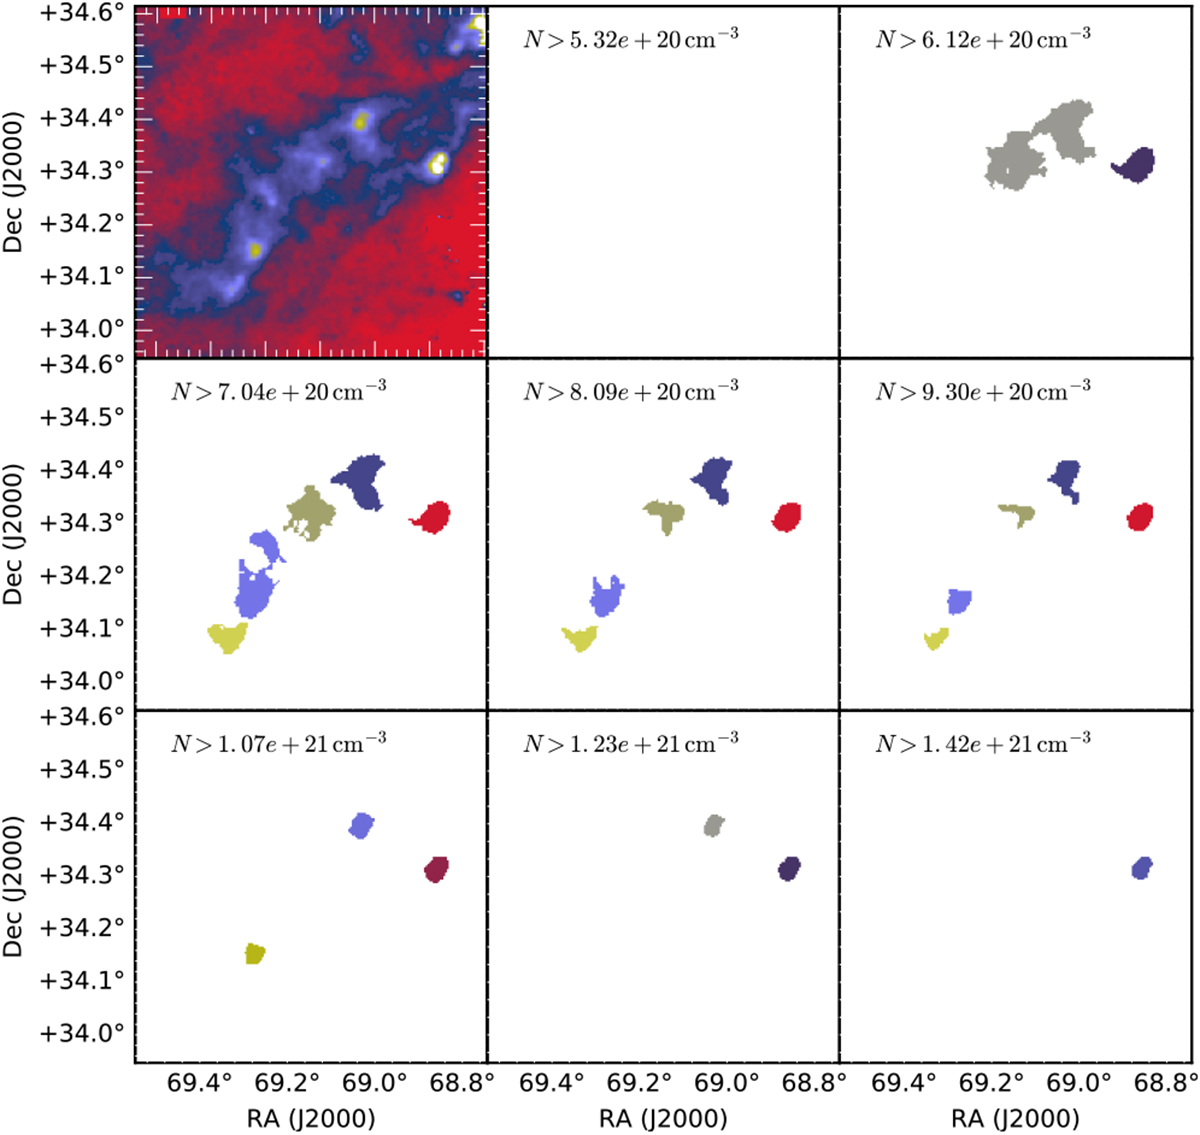
Example of the clump hierarchy. The first frame shows the column density map of the field G167.20–8.69. The other frames show clumps identified on the first seven column density thresholds, different colours denoting different clumps. At the lowest column density threshold, the structure extends beyond the map boundary and therefore is not included in our sample.
Current usage metrics show cumulative count of Article Views (full-text article views including HTML views, PDF and ePub downloads, according to the available data) and Abstracts Views on Vision4Press platform.
Data correspond to usage on the plateform after 2015. The current usage metrics is available 48-96 hours after online publication and is updated daily on week days.
Initial download of the metrics may take a while.