Fig. 18
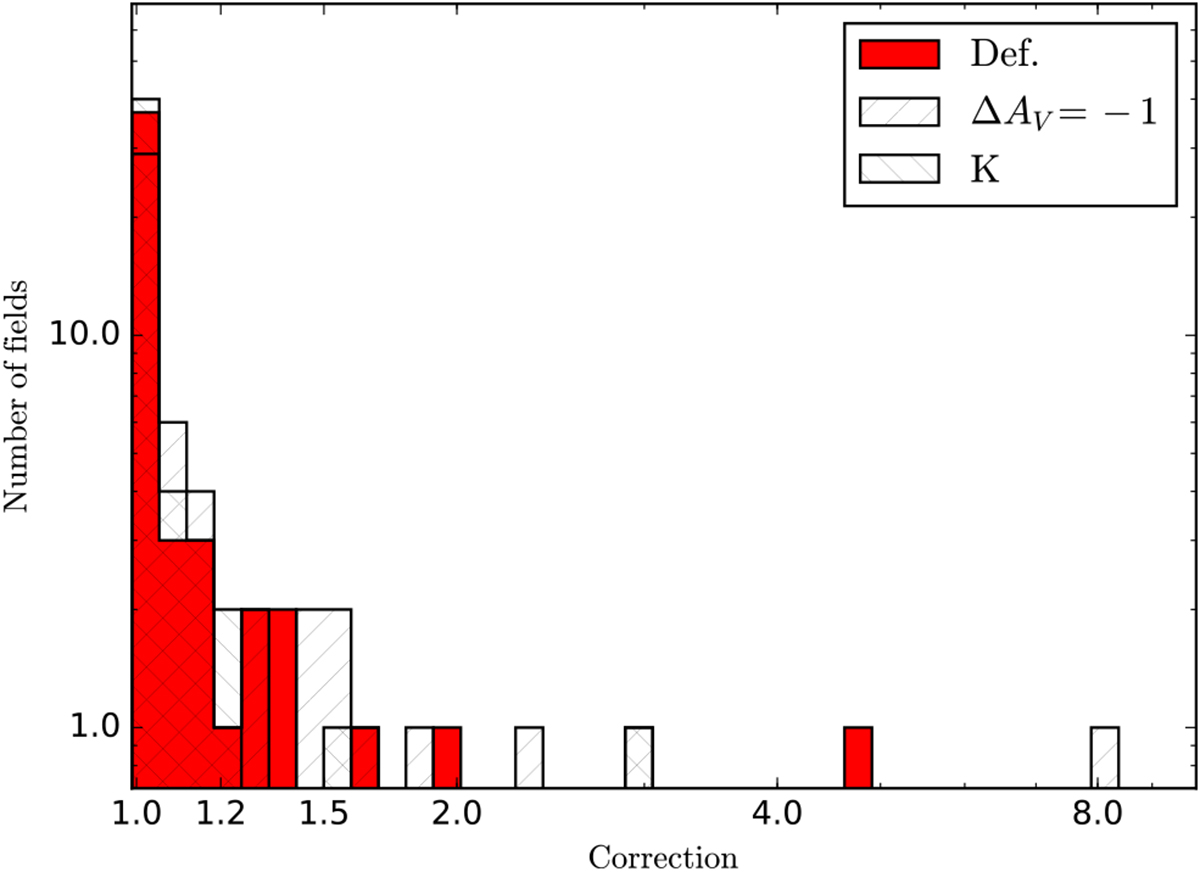
Biasin the column density estimates derived from SED fitting. The plotted quantity is the ratio of the true column density and the column density estimated from SEDs. The histograms represent the distribution of the maximum error in each field, estimated with different versions of the RT models. The default model is shown as the red solid histogram. The alternative model employs a harder radiation field parameterised as Δ AV = −1.
Current usage metrics show cumulative count of Article Views (full-text article views including HTML views, PDF and ePub downloads, according to the available data) and Abstracts Views on Vision4Press platform.
Data correspond to usage on the plateform after 2015. The current usage metrics is available 48-96 hours after online publication and is updated daily on week days.
Initial download of the metrics may take a while.