Fig. 16
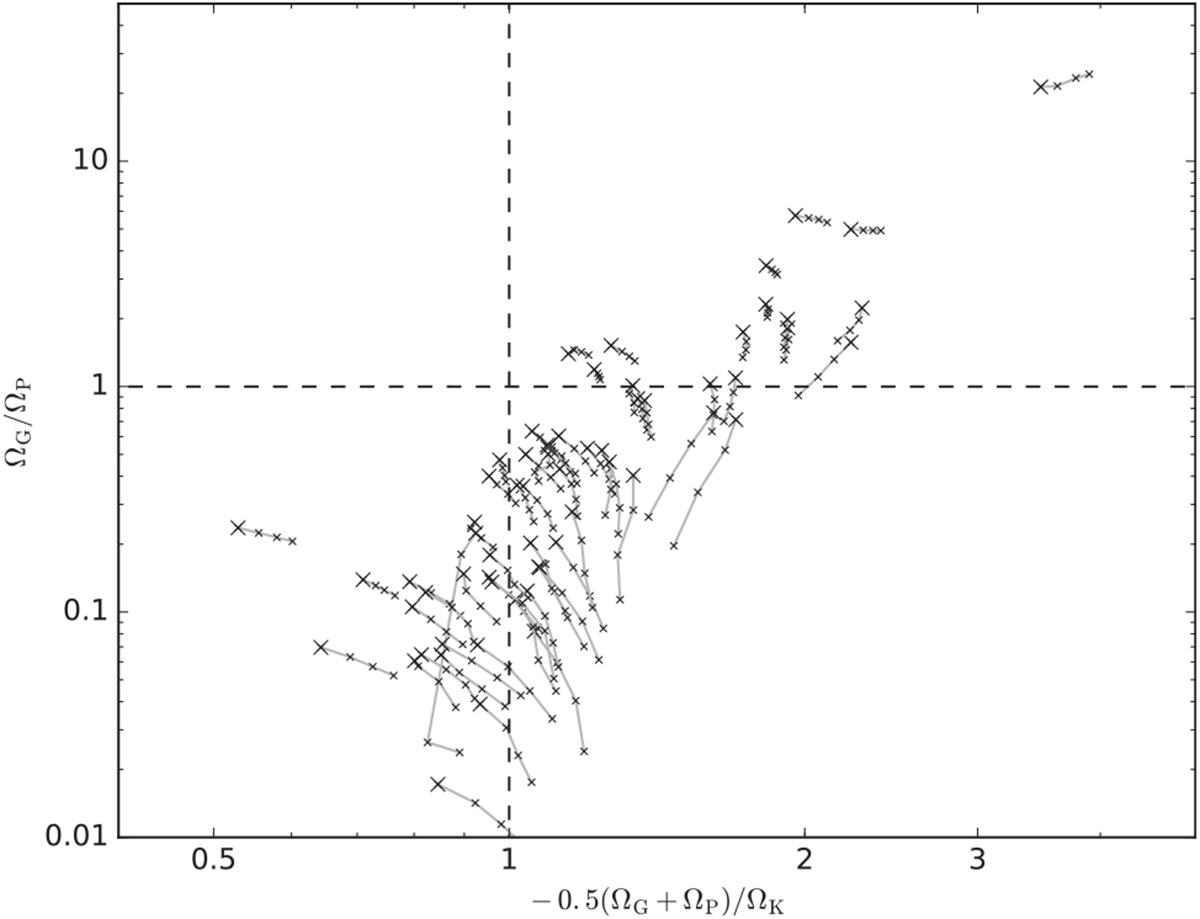
Forthe sample of 3D clumps in Fig. 15, energy ratios based on the terms ΩG, ΩP, and ΩK. The larger symbols refer to clumps with a projected surface area of 10 arcmin2. The smallersymbols, joined by lines, correspond to smaller clumps defined by, in steps of 20%, higher volume density thresholds. The clumps right of the vertical line are bound and the clumps above the horizontal line are dominated by gravity.
Current usage metrics show cumulative count of Article Views (full-text article views including HTML views, PDF and ePub downloads, according to the available data) and Abstracts Views on Vision4Press platform.
Data correspond to usage on the plateform after 2015. The current usage metrics is available 48-96 hours after online publication and is updated daily on week days.
Initial download of the metrics may take a while.