Fig. 15
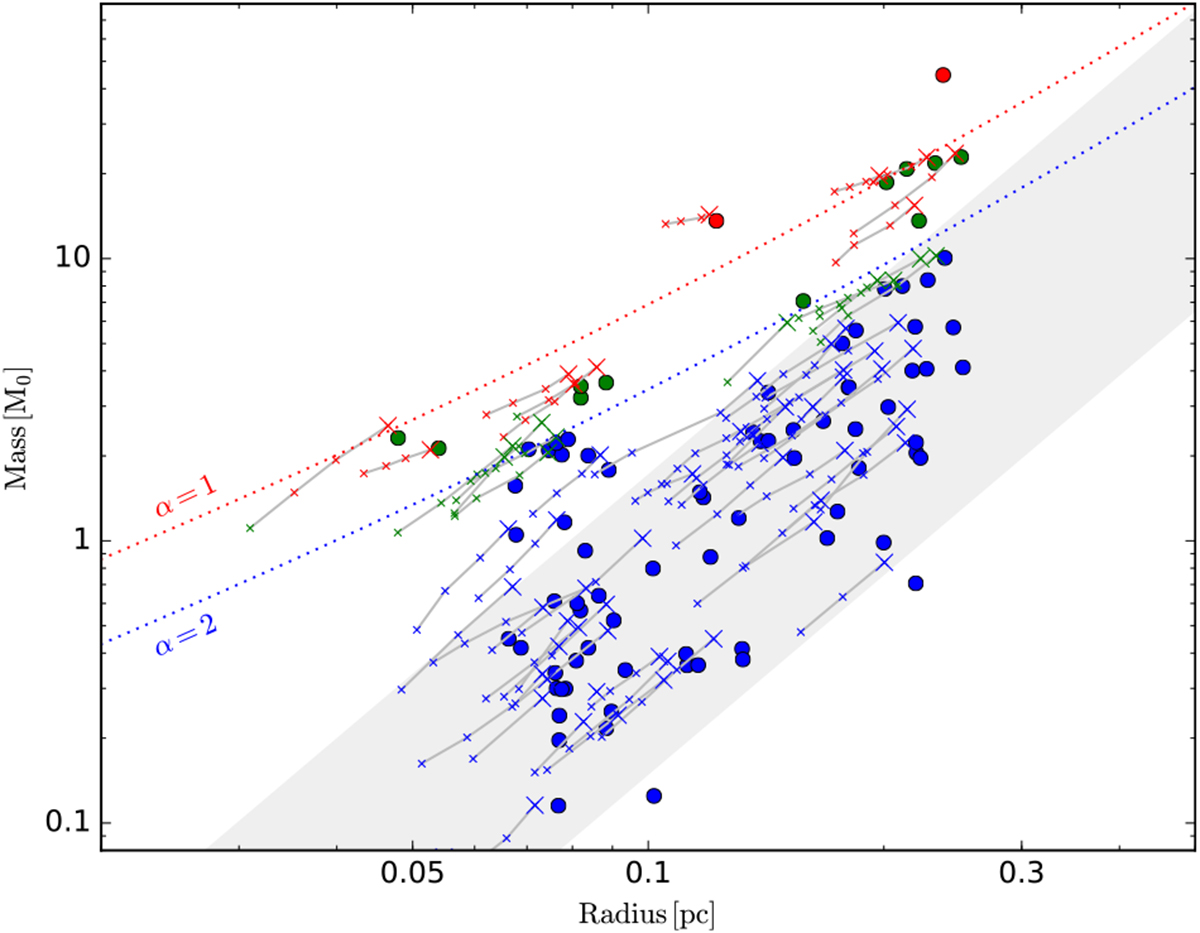
Clump masses as a function of the clump effective radius. The sample consists of 10 arcmin2 clumps. The circles denote values derived from the observed column density maps. The crosses are the values from 3D models, smaller symbols corresponding to progressively higher volume density thresholds. The dotted lines correspond to the values α = 1 and α = 2 of the virial parameter (3D clumps), with the assumptions listed in the text. The red, green, and blue symbols show the actual valueswith α < 1, 1 < α < 2, and α > 2, respectively.The grey band corresponds to an empirical relation of CO clumps (Elmegreen & Falgarone 1996; Pattle et al. 2015).
Current usage metrics show cumulative count of Article Views (full-text article views including HTML views, PDF and ePub downloads, according to the available data) and Abstracts Views on Vision4Press platform.
Data correspond to usage on the plateform after 2015. The current usage metrics is available 48-96 hours after online publication and is updated daily on week days.
Initial download of the metrics may take a while.