Fig. 13
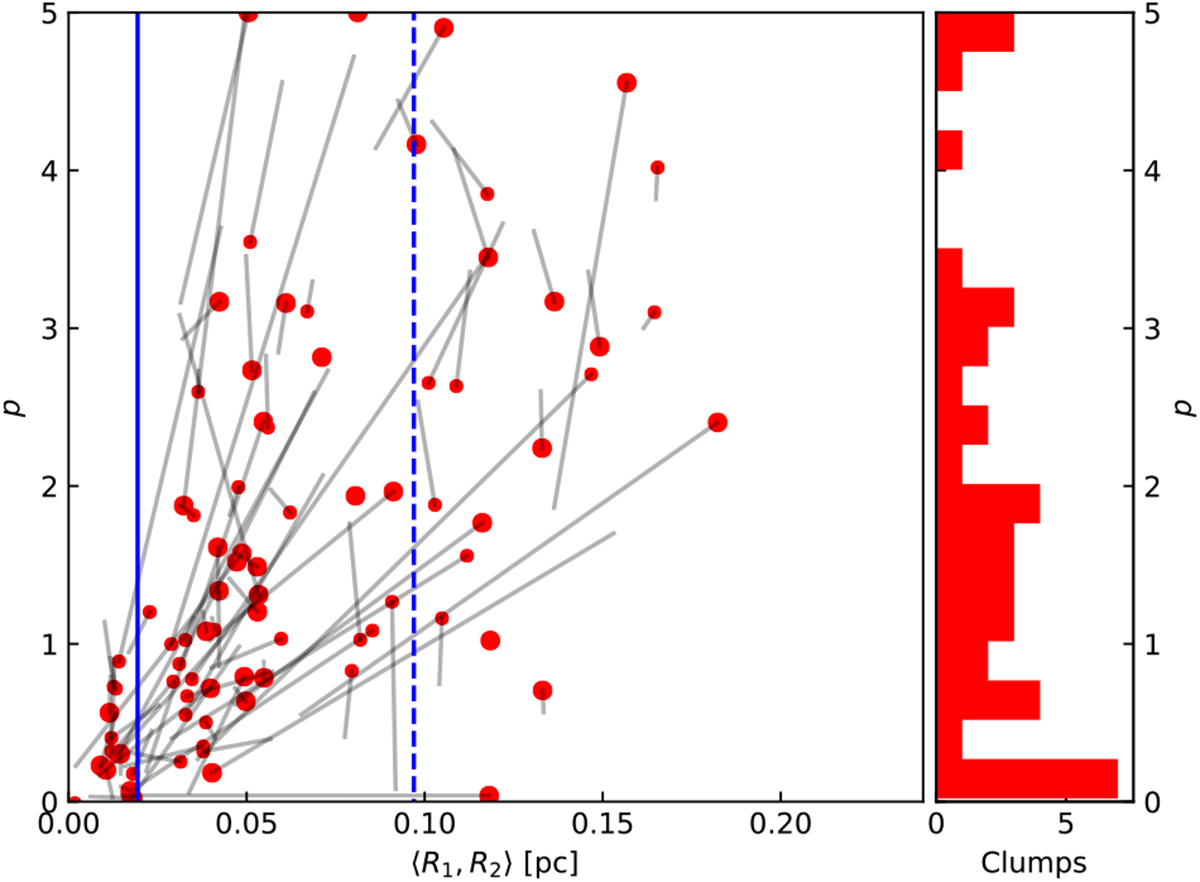
Results of 2D Plummer function fits. The circles correspond to the parameters p that are plotted against the geometrical mean of the flat radii R1 and R2, which correspond to the clump major axis and minor axis directions. The solid lines are drawn from the plotted circles to the parameter combination that is obtained when clumps are selected at a 15% higher-column-density threshold. The solid and dashed vertical lines correspond to 40′′ at 100 pc and 500 pc distances, respectively. The right panel shows the distribution of p values (0 ≤ p ≤ 5 only) corresponding to the red symbols of the first frame.
Current usage metrics show cumulative count of Article Views (full-text article views including HTML views, PDF and ePub downloads, according to the available data) and Abstracts Views on Vision4Press platform.
Data correspond to usage on the plateform after 2015. The current usage metrics is available 48-96 hours after online publication and is updated daily on week days.
Initial download of the metrics may take a while.