Free Access
Fig. 11
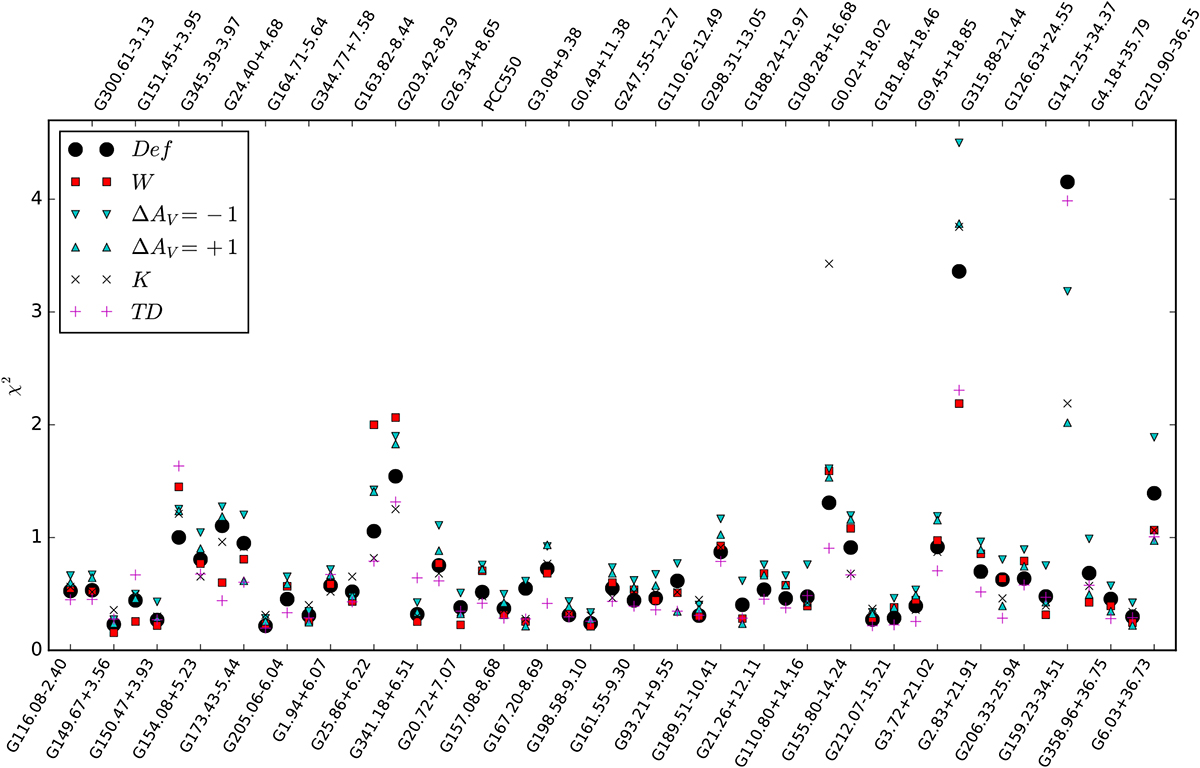
χ2 values of the RT model fits. The reduced χ2 values are calculated over the 250, 350, and 500 μm maps assuming an observational uncertainty of 7%. The fields are arranged in the order of increasing |b|. The legend refers to the model variations listed in Table 2.
Current usage metrics show cumulative count of Article Views (full-text article views including HTML views, PDF and ePub downloads, according to the available data) and Abstracts Views on Vision4Press platform.
Data correspond to usage on the plateform after 2015. The current usage metrics is available 48-96 hours after online publication and is updated daily on week days.
Initial download of the metrics may take a while.