Fig. 1
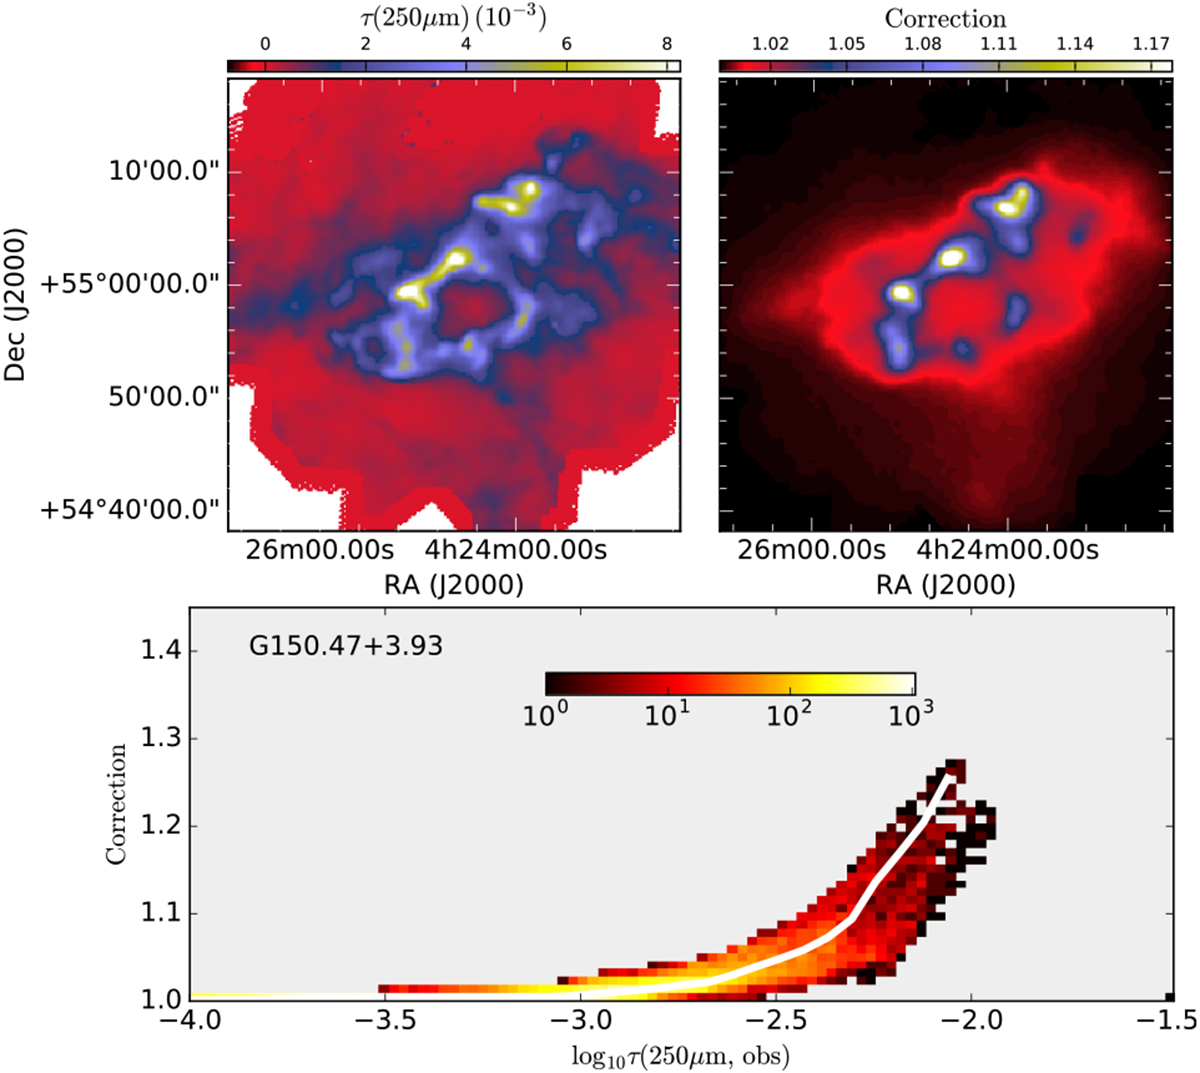
Example of probable column density biases (field G150.47+3.93). The first frame shows the optical depth map derived from observations. Based on RT modelling, and the other frames show the ratio ξN between the true column density of the model cloud and the column density derived from the model-predicted surface-brightness maps. The bottom frame shows this ratio as a function of the 250 μm optical depth. The colours correspond to the number of map pixels per parameter area, as indicated by the colour bar. The white curve shows the median relation.
Current usage metrics show cumulative count of Article Views (full-text article views including HTML views, PDF and ePub downloads, according to the available data) and Abstracts Views on Vision4Press platform.
Data correspond to usage on the plateform after 2015. The current usage metrics is available 48-96 hours after online publication and is updated daily on week days.
Initial download of the metrics may take a while.