Fig. 2
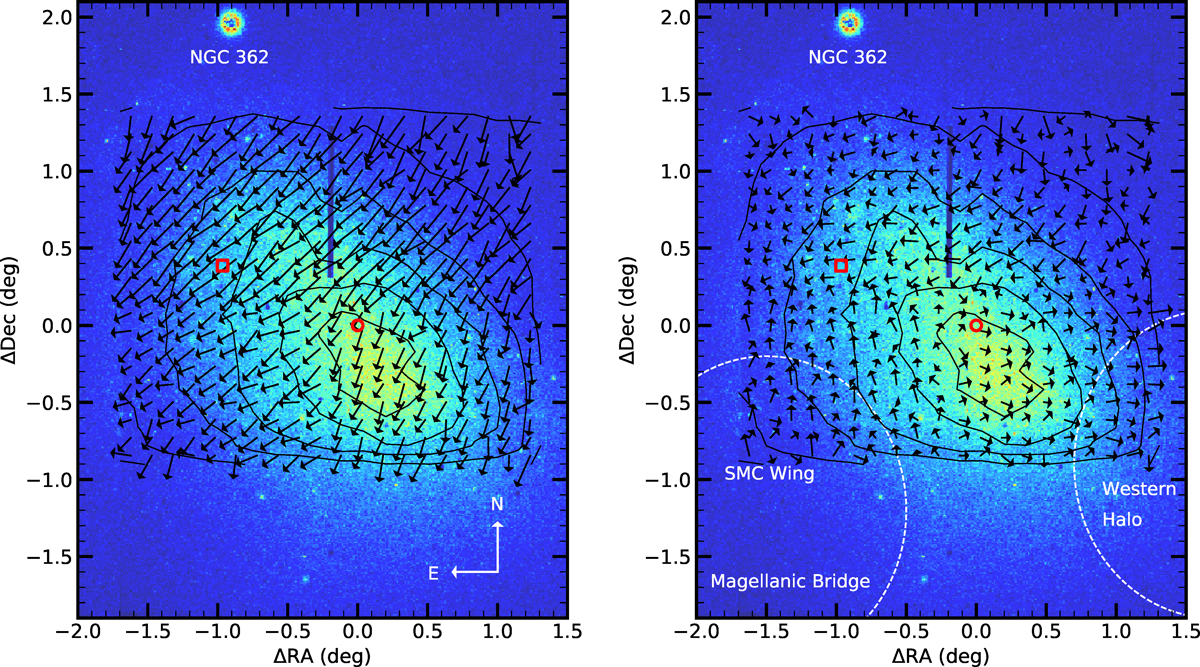
Proper-motion field (black arrows) of the central regions of the SMC from four tiles of VMC data. The backgroundcolor image is a density map of objects detected by the VMC. The panel is centered at the optical center of the SMC (red circle) as given by de Vaucouleurs & Freeman (1972), also shown as a red square is the kinematical H I center (Stanimirović et al. 2004). North of the main body of the SMC, the foreground Galactic globular cluster NGC 362 is visible. Black solid lines show density contours of sources for which proper motions have been measured. The contours are at 500, 1500, 3500, 5500, 7500 and 9500 stars per grid cell. The vertical dark stripe at ΔRA ~ −0.2° is due to a narrow gap in the observations. In the left-hand panel, the arrows indicate the observed absolute proper motion, whereas in the right-hand panel, the arrows show the residual proper motions after subtraction of the systemic velocity of the SMC.
Current usage metrics show cumulative count of Article Views (full-text article views including HTML views, PDF and ePub downloads, according to the available data) and Abstracts Views on Vision4Press platform.
Data correspond to usage on the plateform after 2015. The current usage metrics is available 48-96 hours after online publication and is updated daily on week days.
Initial download of the metrics may take a while.