Fig. 1
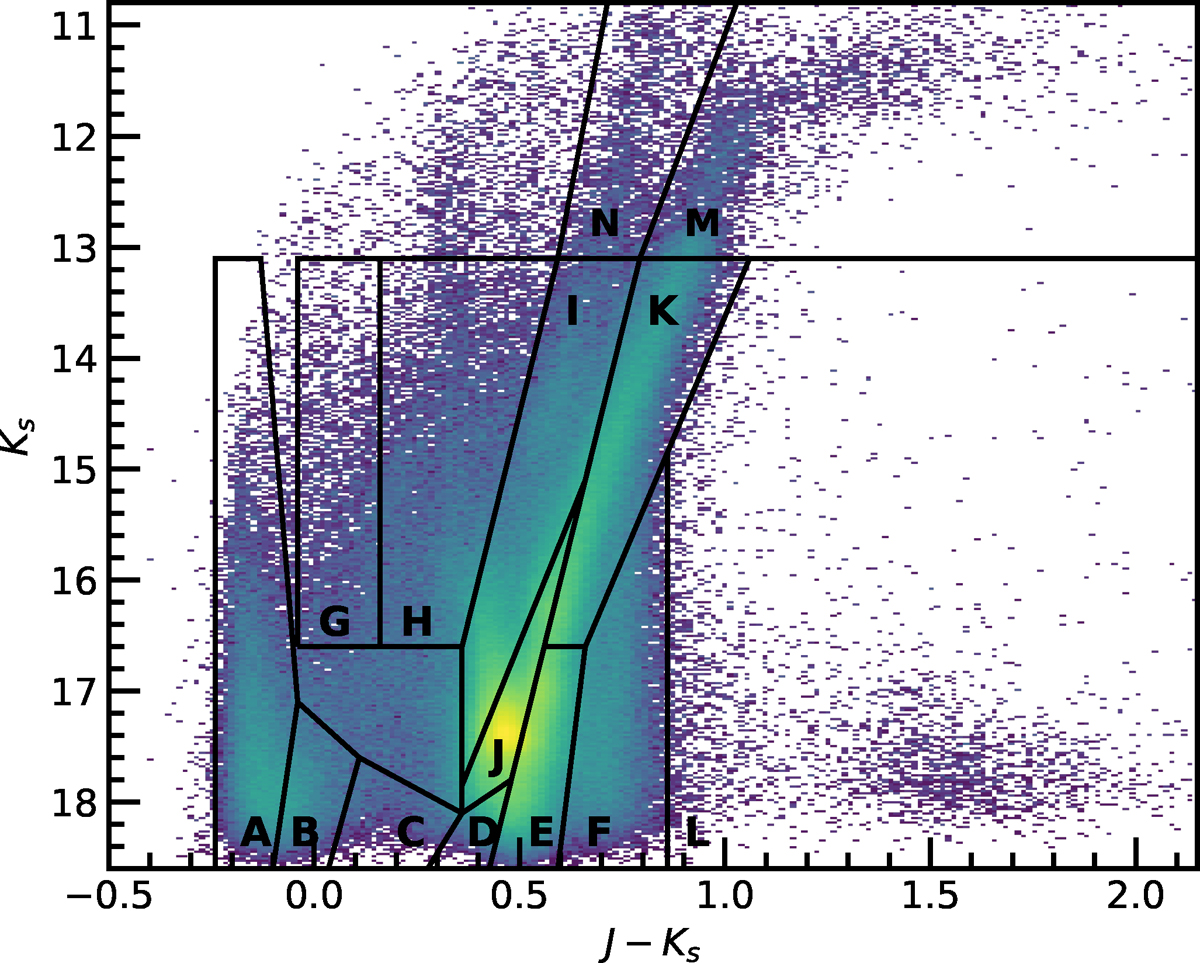
Stellar density (Hess) diagram in the (J − Ks, Ks) color-magnitude space of all sources with proper motions measurements. Overplotted as black polygons are regions of different stellar populations as defined by Cioni et al. (2016) and El Youssoufi et al. (in prep.), the latter adding regions M and N and extending regions A and L.
Current usage metrics show cumulative count of Article Views (full-text article views including HTML views, PDF and ePub downloads, according to the available data) and Abstracts Views on Vision4Press platform.
Data correspond to usage on the plateform after 2015. The current usage metrics is available 48-96 hours after online publication and is updated daily on week days.
Initial download of the metrics may take a while.