Fig. A.1
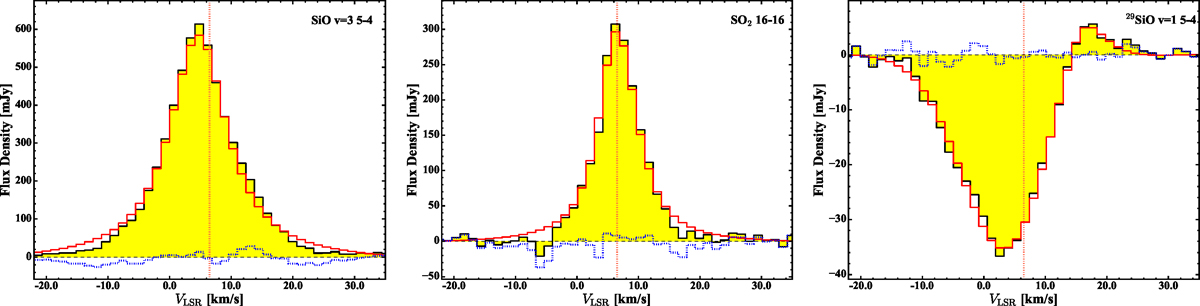
Total intensity spectrum of the 28SiO v = 3, J = 5 − 4 (left) and the SO2![]() (middle), and the 29SiO v = 1, J = 5 − 4 (right) transitions around R Dor. The spectra are extracted using a circular aperture with a diameter of 0.09′′, 0.2′′, and 0.075′′ for the SiO v= 3, SO2, and 29SiO v = 1 lines, respectively. The observed spectra are shown in black. The best-fit CASA specfit model for each line is shown in red, while the residuals are indicated by the dashed blue histogram.
(middle), and the 29SiO v = 1, J = 5 − 4 (right) transitions around R Dor. The spectra are extracted using a circular aperture with a diameter of 0.09′′, 0.2′′, and 0.075′′ for the SiO v= 3, SO2, and 29SiO v = 1 lines, respectively. The observed spectra are shown in black. The best-fit CASA specfit model for each line is shown in red, while the residuals are indicated by the dashed blue histogram.
Current usage metrics show cumulative count of Article Views (full-text article views including HTML views, PDF and ePub downloads, according to the available data) and Abstracts Views on Vision4Press platform.
Data correspond to usage on the plateform after 2015. The current usage metrics is available 48-96 hours after online publication and is updated daily on week days.
Initial download of the metrics may take a while.