Free Access
Fig. B.1
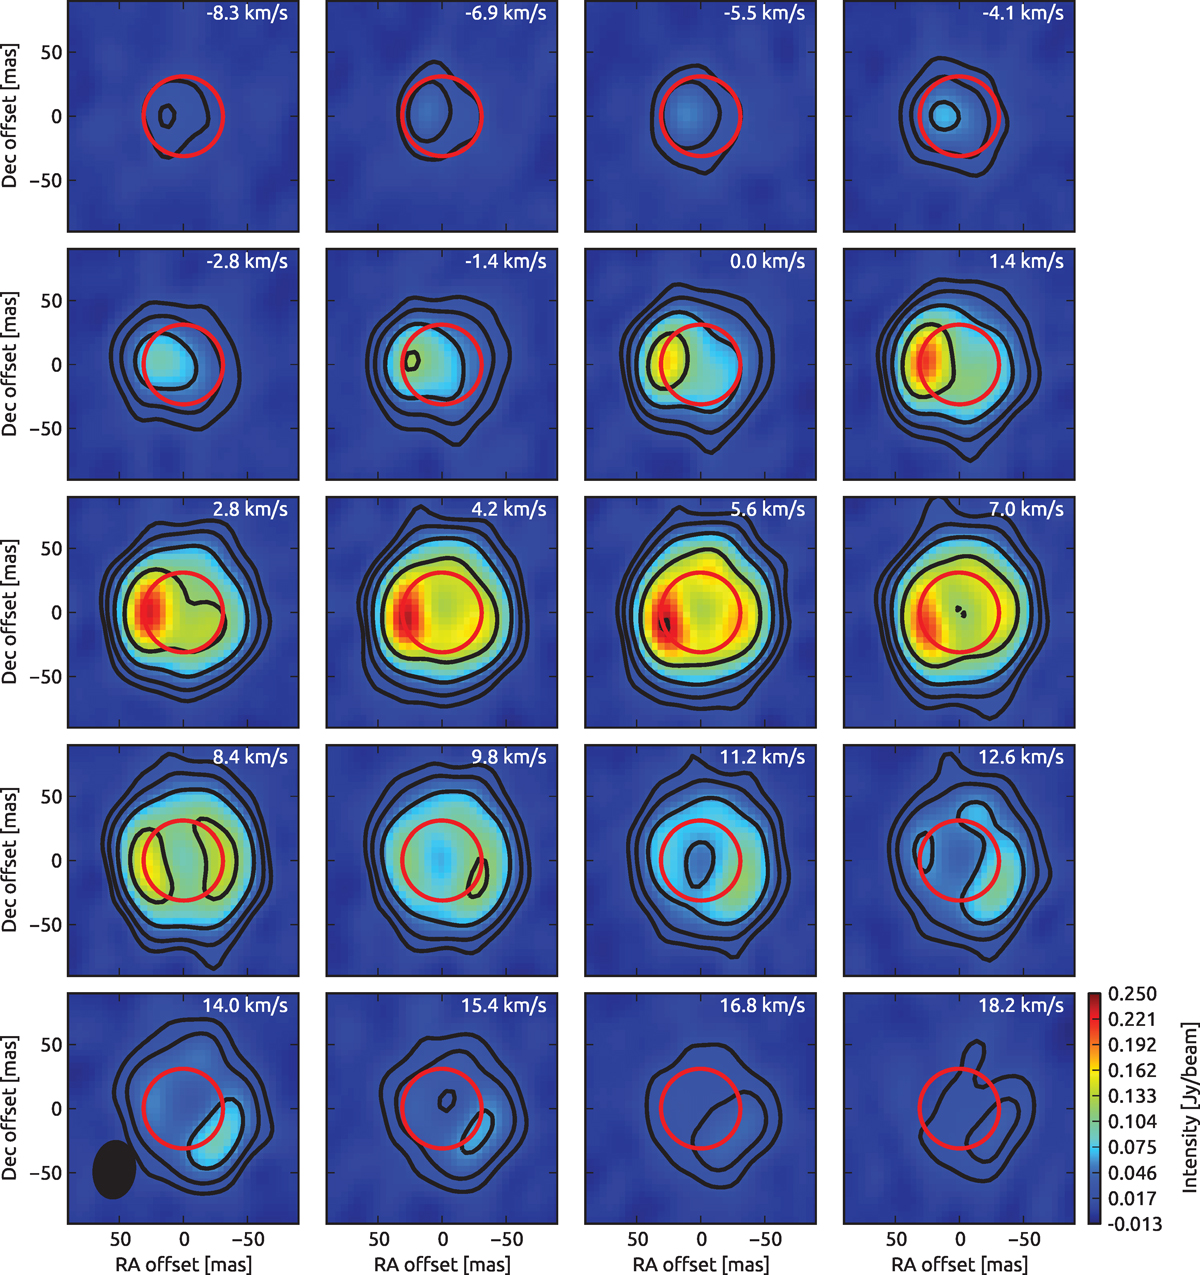
Channel maps for the SiO v = 3, J = 5 − 4 emission line. The red ellipse denotes the size of the measured stellar disc. Contours are drawn at 6, 12, 24, 48, and 96σ with σ = 2.5 mJy beam−1. The beam size is indicated in the bottom left panel.
Current usage metrics show cumulative count of Article Views (full-text article views including HTML views, PDF and ePub downloads, according to the available data) and Abstracts Views on Vision4Press platform.
Data correspond to usage on the plateform after 2015. The current usage metrics is available 48-96 hours after online publication and is updated daily on week days.
Initial download of the metrics may take a while.