Fig. 3
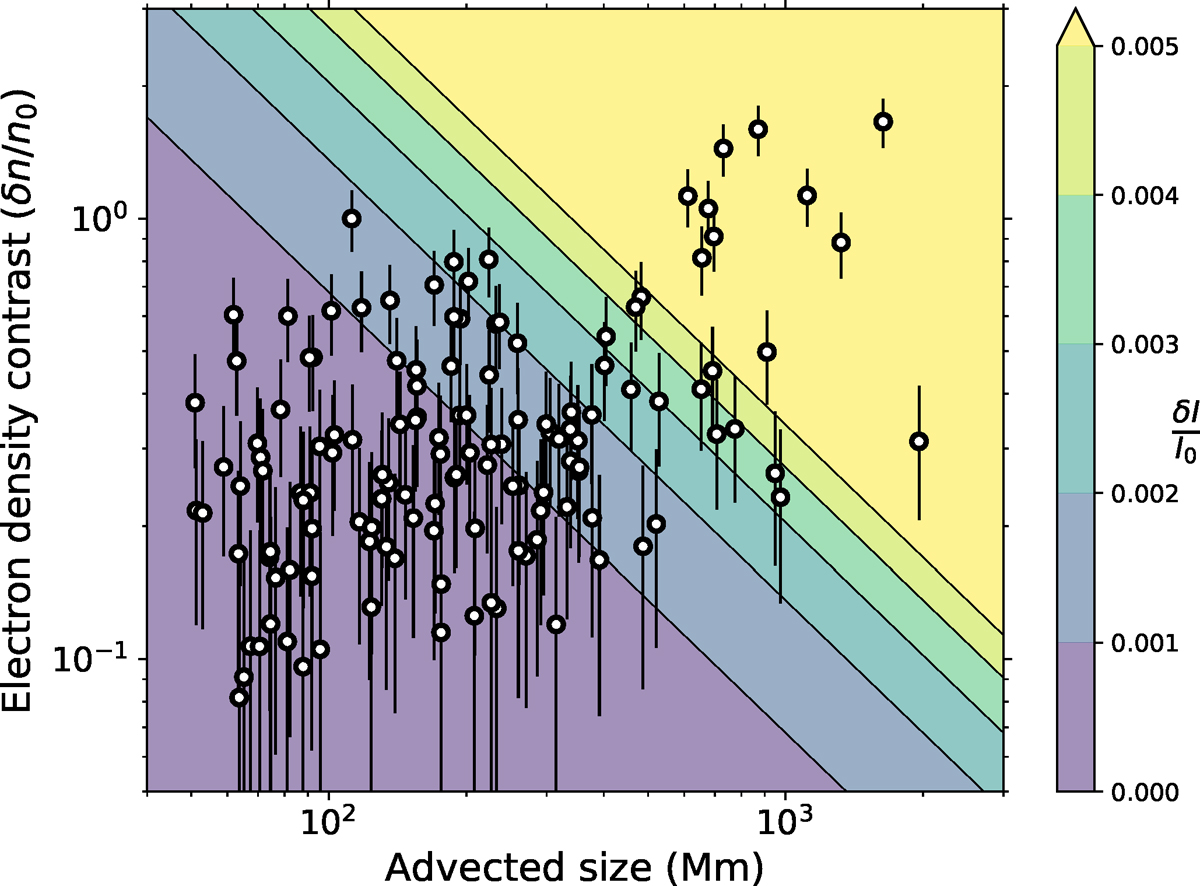
Scatter plot of electron density contrast (y-axis) against advected structure size (x-axis) . Uncertainties in electron density contrast are due to not knowing the variation of the alpha particle abundance within the structures. Background shading shows contours of Eq. (2) with r0 = 0.3 AU, which gives the fractional change in intensity a white-light instrument at 1 AU would see when viewing the blobs. The fractional intensity change values assume zero velocity smear across the observing instrument.
Current usage metrics show cumulative count of Article Views (full-text article views including HTML views, PDF and ePub downloads, according to the available data) and Abstracts Views on Vision4Press platform.
Data correspond to usage on the plateform after 2015. The current usage metrics is available 48-96 hours after online publication and is updated daily on week days.
Initial download of the metrics may take a while.