Fig. 2
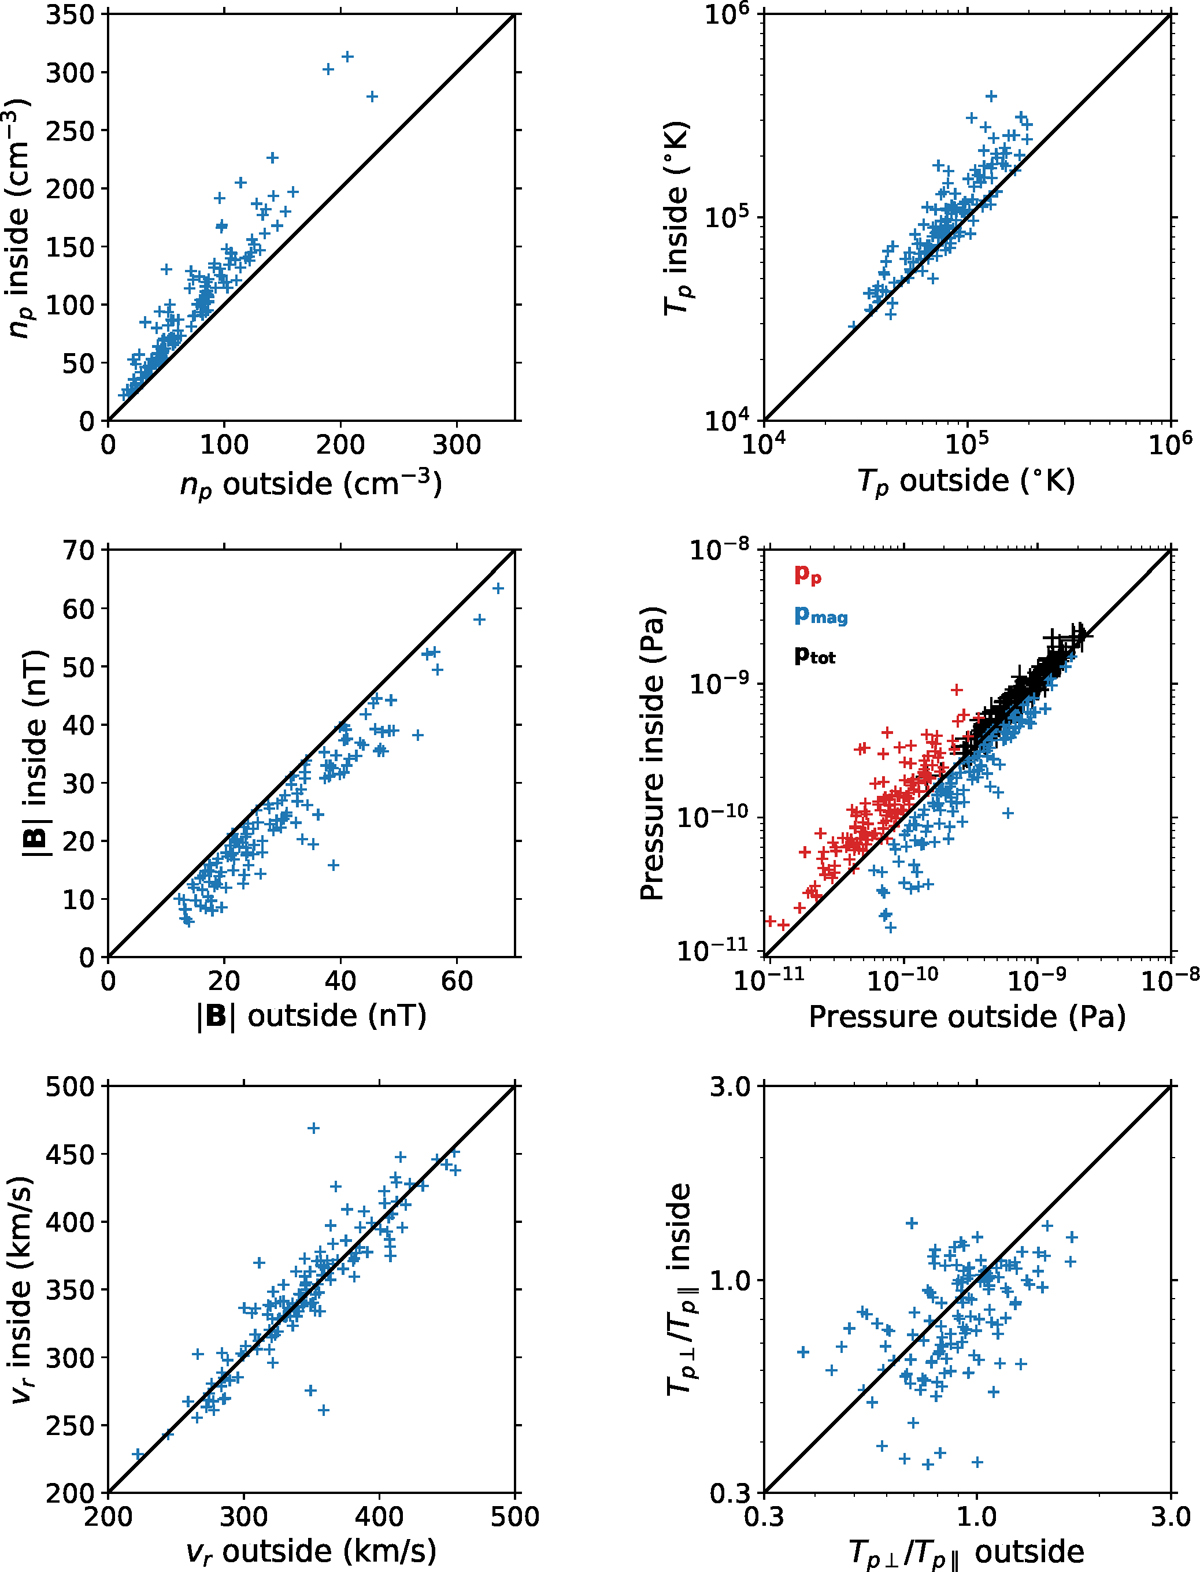
Scatter plots of quantities inside the structures (y-axis) against quantities outside the structures (x-axis). One-to-one line are drawn in black on each plot. Points lying above these lines indicate a quantity larger inside a structure relative to outside and vice versa. Top left: proton core number density (np ) and top right total proton temperature (Tp). Middle left: magnetic field magnitude (![]() ) and middle right magnetic (blue) proton thermal (red) and total (black) pressures. The total pressure crosses are error-bars in both directions due to uncertainty in the electron and alpha thermal pressure contribution to the total pressure. Bottom left: radial proton velocity (vr ) and bottom right proton temperature anisotropy (Tp⊥∕Tp∥).
) and middle right magnetic (blue) proton thermal (red) and total (black) pressures. The total pressure crosses are error-bars in both directions due to uncertainty in the electron and alpha thermal pressure contribution to the total pressure. Bottom left: radial proton velocity (vr ) and bottom right proton temperature anisotropy (Tp⊥∕Tp∥).
Current usage metrics show cumulative count of Article Views (full-text article views including HTML views, PDF and ePub downloads, according to the available data) and Abstracts Views on Vision4Press platform.
Data correspond to usage on the plateform after 2015. The current usage metrics is available 48-96 hours after online publication and is updated daily on week days.
Initial download of the metrics may take a while.