Fig. 1
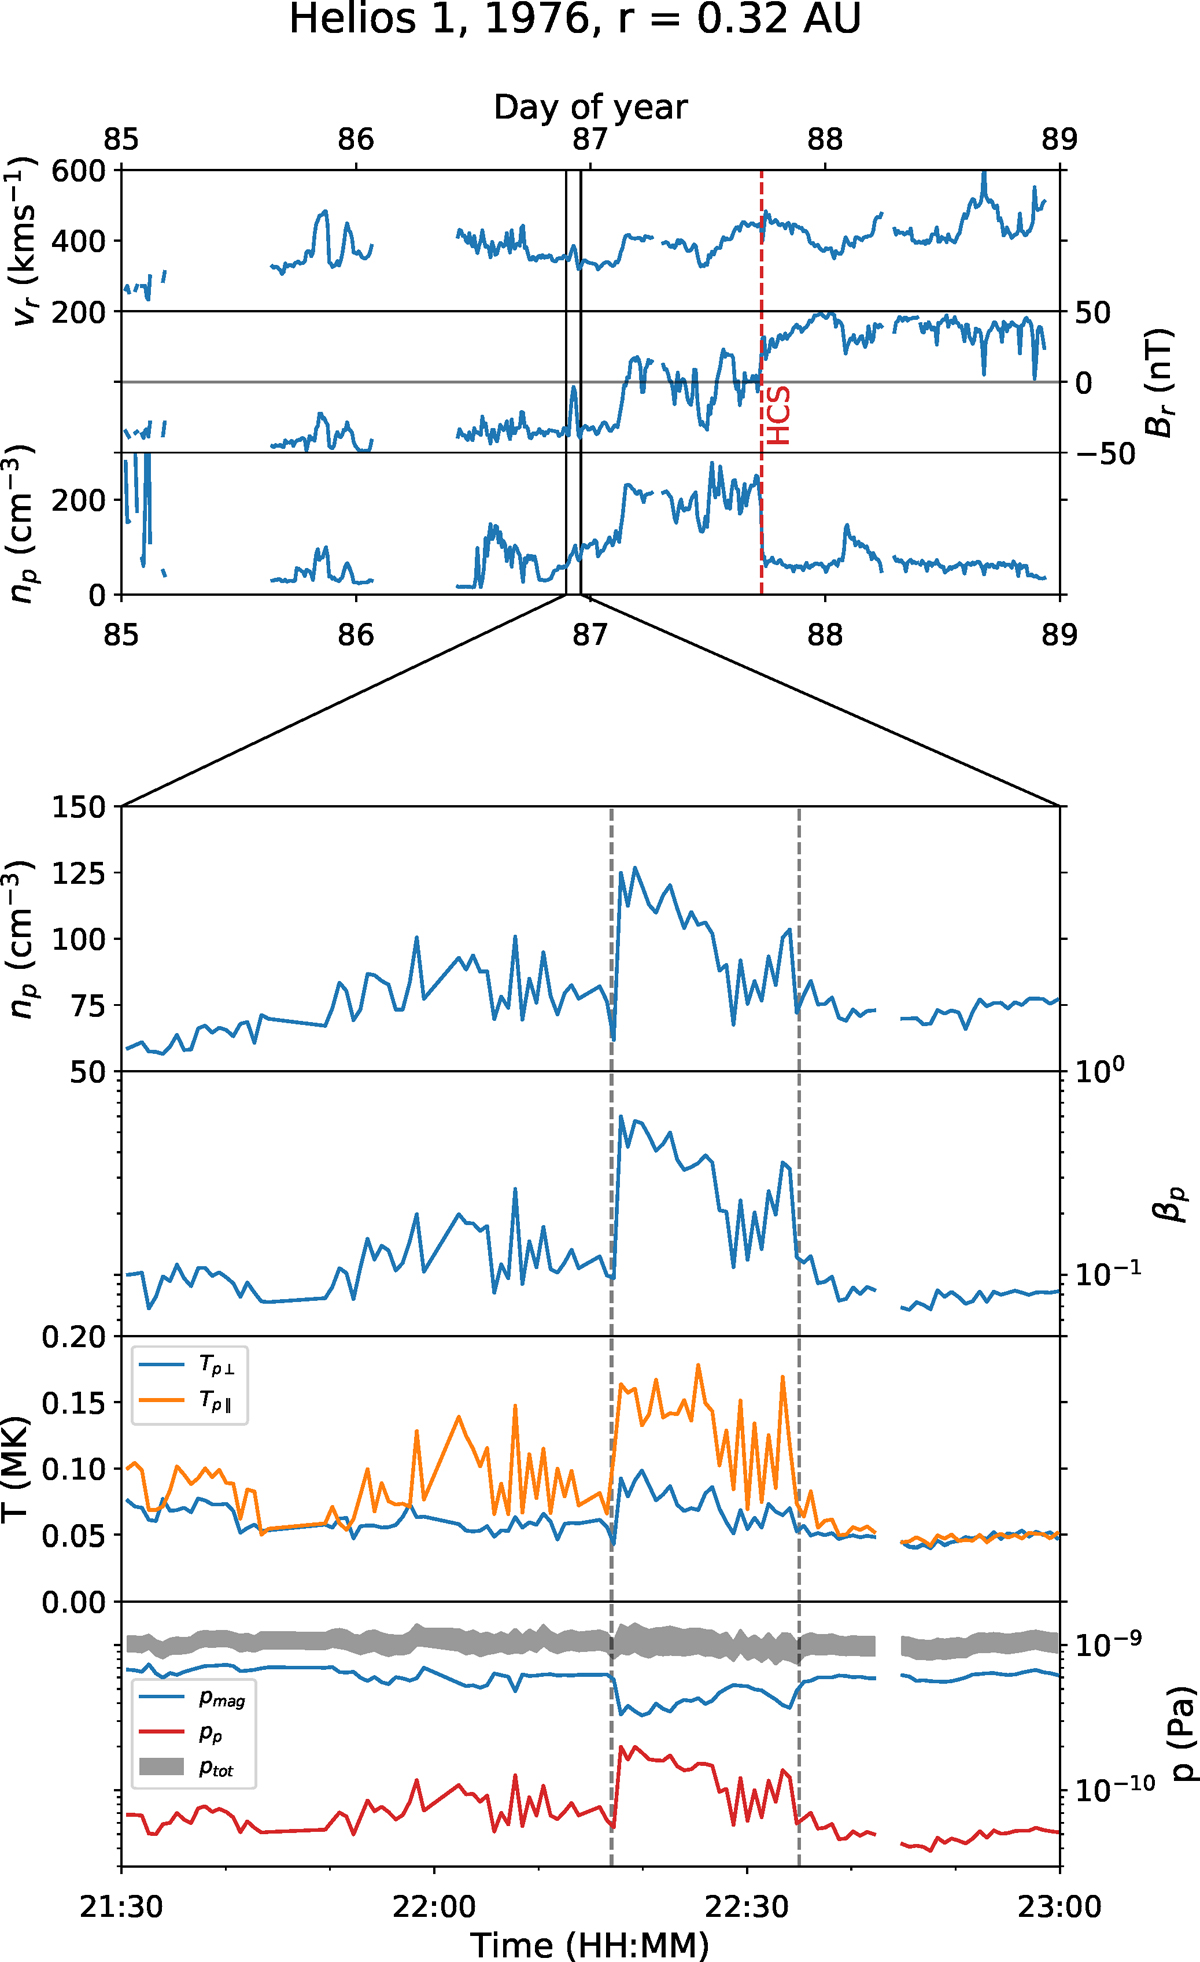
An example number density structure. Top three panels: a 4 day overview of 10 min averaged radial proton bulk speed (vr, top axis), radial magnetic field (Br, middle axis), and proton number density (np, bottom axis). The HCS crossing is marked with a red dashed line between days 87 and 88. Bottom four panels: a shorter 1.5 h interval, with the structure present between the grey dashed lines. The top axis shows proton number density (np ), and the second axis proton plasma beta (βp). The third axis shows proton parallel temperature (orange, Tp∥) and proton perpendicular temperature (blue, Tp⊥). The fourth axis shows the proton thermal pressure (red, pp), magnetic pressure (blue, pmag), and total pressure (grey, ptot). The range of values in the total pressure is due to uncertainty in the number density and temperature of electrons and alpha particles.
Current usage metrics show cumulative count of Article Views (full-text article views including HTML views, PDF and ePub downloads, according to the available data) and Abstracts Views on Vision4Press platform.
Data correspond to usage on the plateform after 2015. The current usage metrics is available 48-96 hours after online publication and is updated daily on week days.
Initial download of the metrics may take a while.