Fig. 11
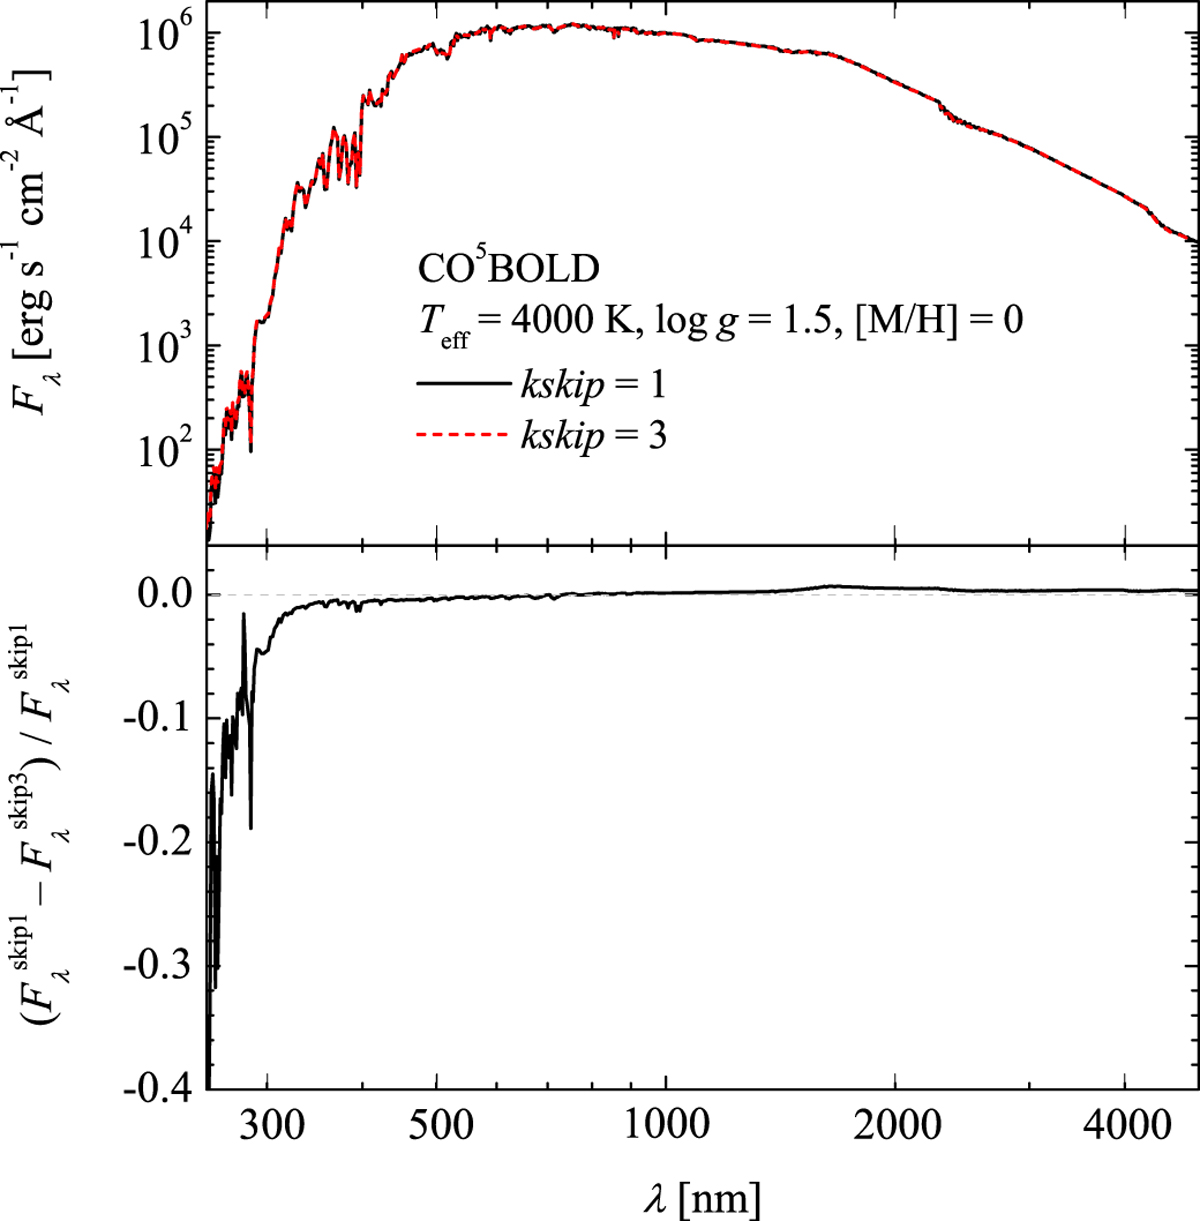
Top: SEDs computed using the original grid of the model atmosphere (kskip = 1) and a coarser grid covering each third cell of the original grid (kskip = 3). A single snapshot of the 3D hydrodynamical model of a red giant was used in the computation of both SEDs. Bottom: differences between the two SEDs shown in the top panel.
Current usage metrics show cumulative count of Article Views (full-text article views including HTML views, PDF and ePub downloads, according to the available data) and Abstracts Views on Vision4Press platform.
Data correspond to usage on the plateform after 2015. The current usage metrics is available 48-96 hours after online publication and is updated daily on week days.
Initial download of the metrics may take a while.