Fig. 4
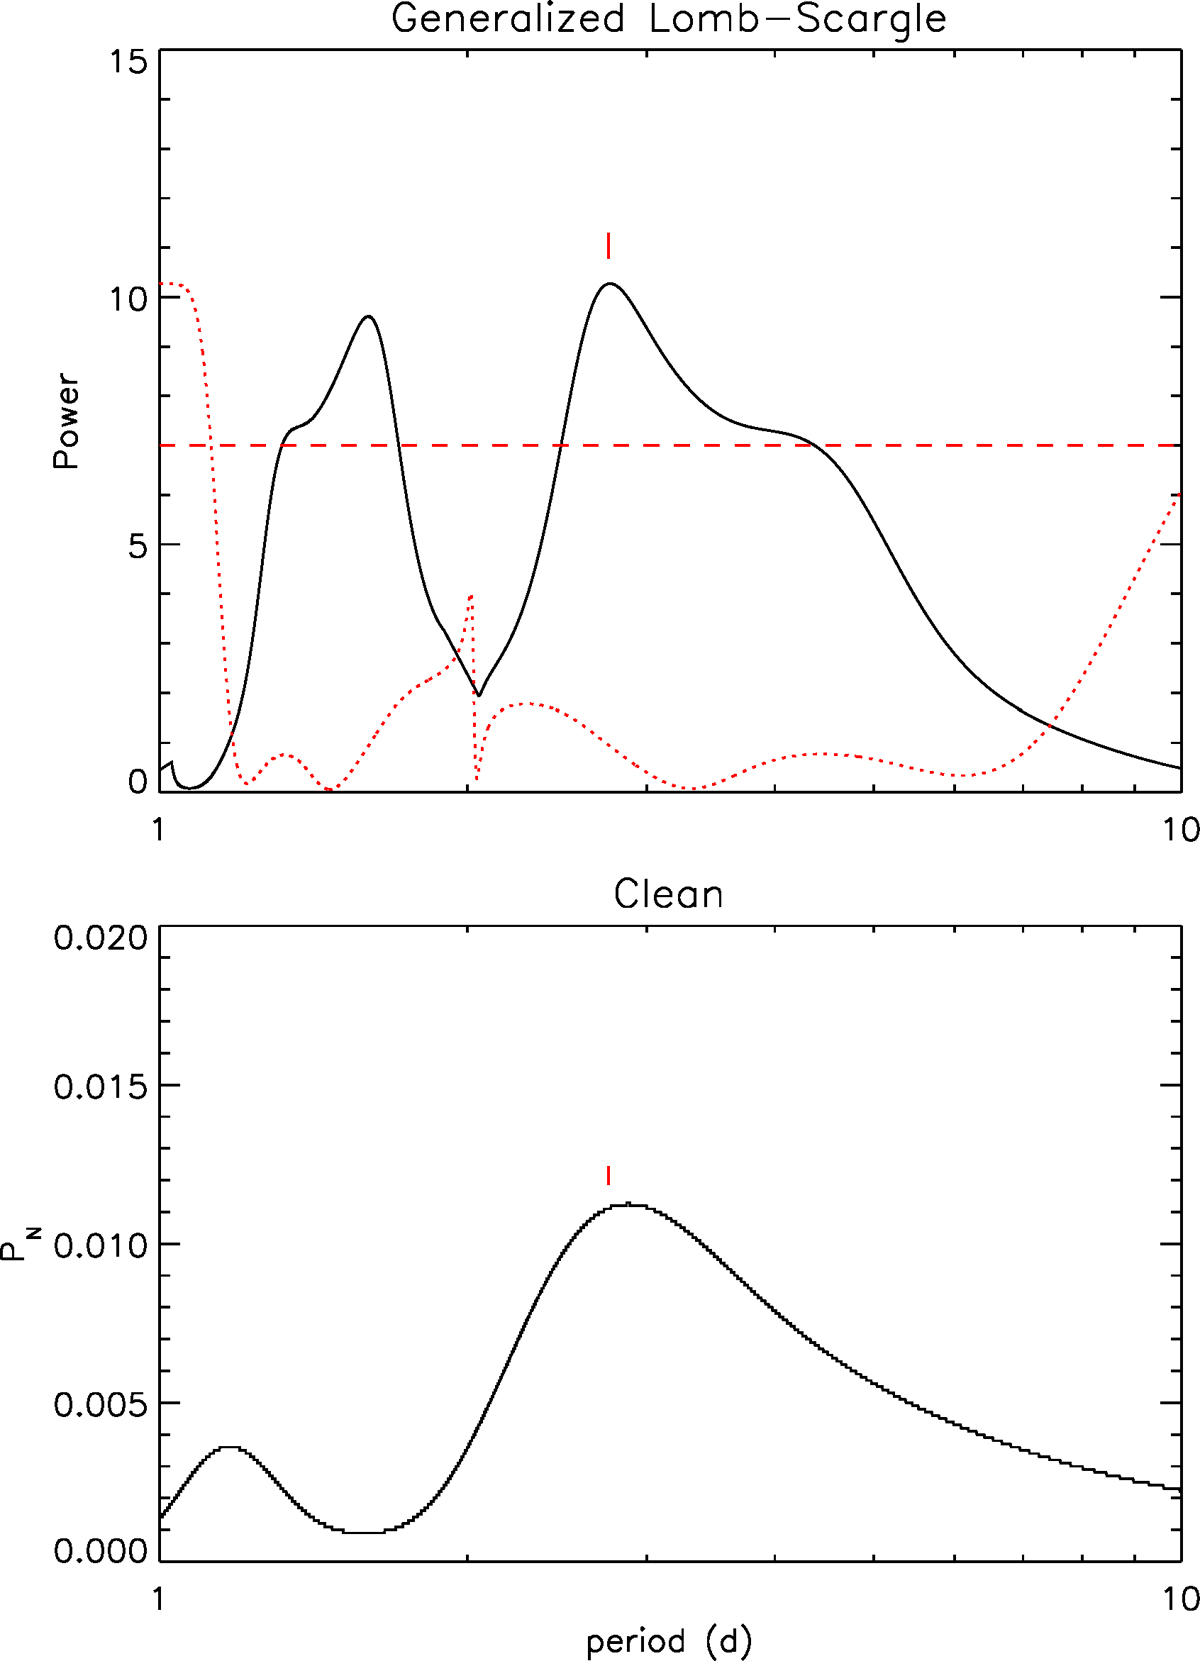
Top panel: generalized Lomb-Scargle periodogram of the g-band photometric time series of BD+20 1790. The solid black line isthe normalized power versus period, the dotted red line is the spectral window, and the horizontal dashed line indicates the power level corresponding to a FAP = 0.01. Bottom panel: CLEAN periodogram. The red mark is the most powerful and significant peak in the periodogram.
Current usage metrics show cumulative count of Article Views (full-text article views including HTML views, PDF and ePub downloads, according to the available data) and Abstracts Views on Vision4Press platform.
Data correspond to usage on the plateform after 2015. The current usage metrics is available 48-96 hours after online publication and is updated daily on week days.
Initial download of the metrics may take a while.