Fig. 5
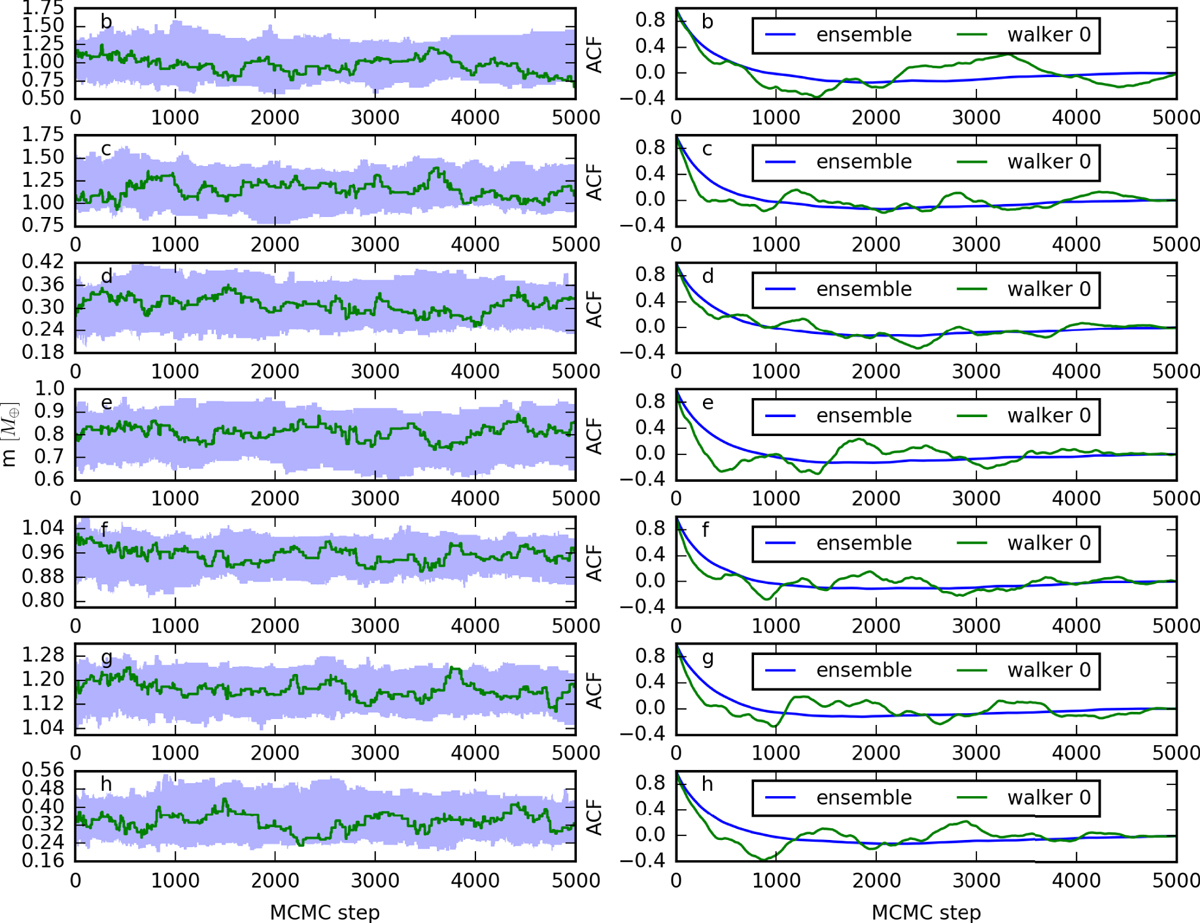
Left panels: evolution of the masses of all planets of the entire ensemble of 100 walker chains in blue, and the evolution of a single chain in green. Right panels: auto-correlation function of the masses for the ensemble and a single chain.
Current usage metrics show cumulative count of Article Views (full-text article views including HTML views, PDF and ePub downloads, according to the available data) and Abstracts Views on Vision4Press platform.
Data correspond to usage on the plateform after 2015. The current usage metrics is available 48-96 hours after online publication and is updated daily on week days.
Initial download of the metrics may take a while.