Fig. 2
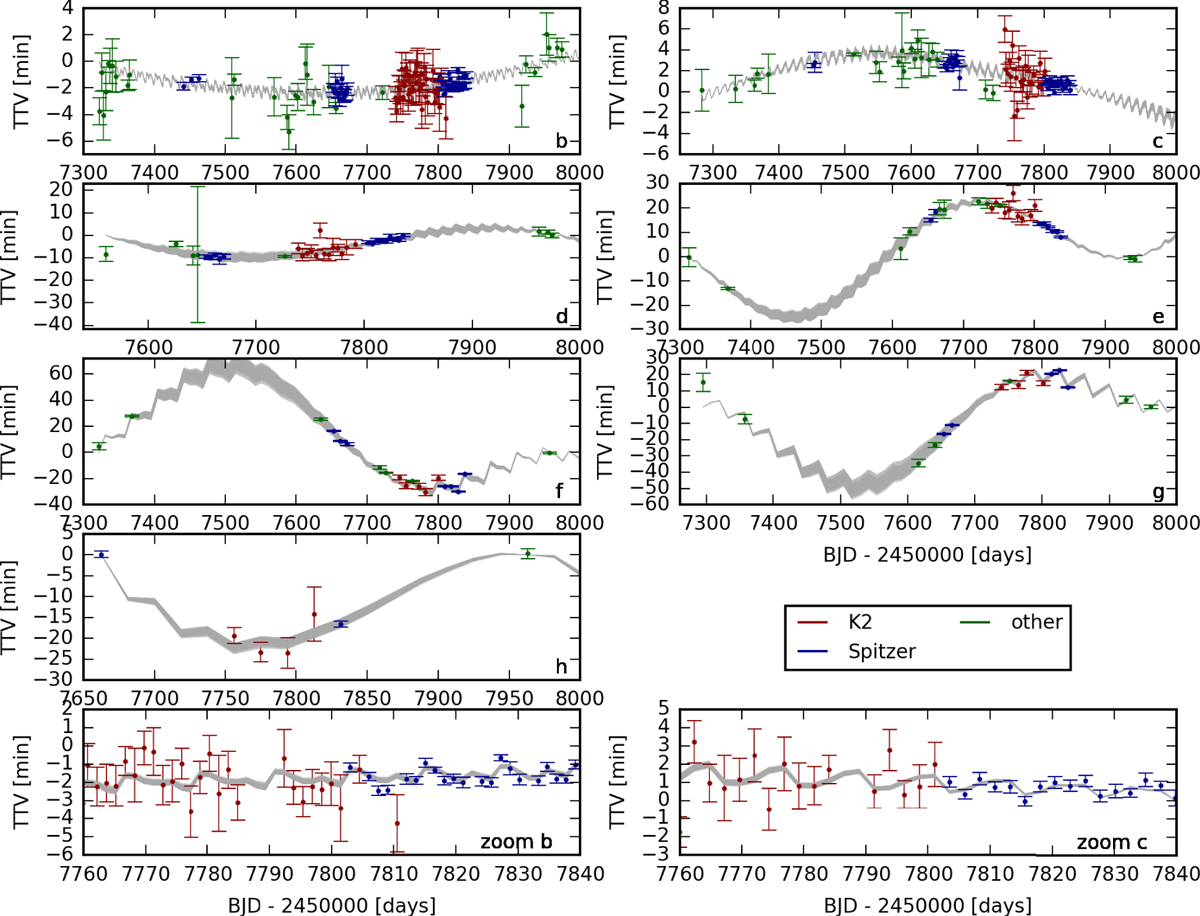
Calculated TTVs for all planets and for 1000 different MCMC samples (grey lines). Measured transit times with the corresponding uncertainties are indicated by coloured symbols, according to the used telescope. A detailed list of all transits is given in Appendix. The differences between the solutions reflect the distribution shown in Fig. 4 for τ = 1. The two panels at the bottom show a zoomed region for planet b and c.
Current usage metrics show cumulative count of Article Views (full-text article views including HTML views, PDF and ePub downloads, according to the available data) and Abstracts Views on Vision4Press platform.
Data correspond to usage on the plateform after 2015. The current usage metrics is available 48-96 hours after online publication and is updated daily on week days.
Initial download of the metrics may take a while.