Fig. 1
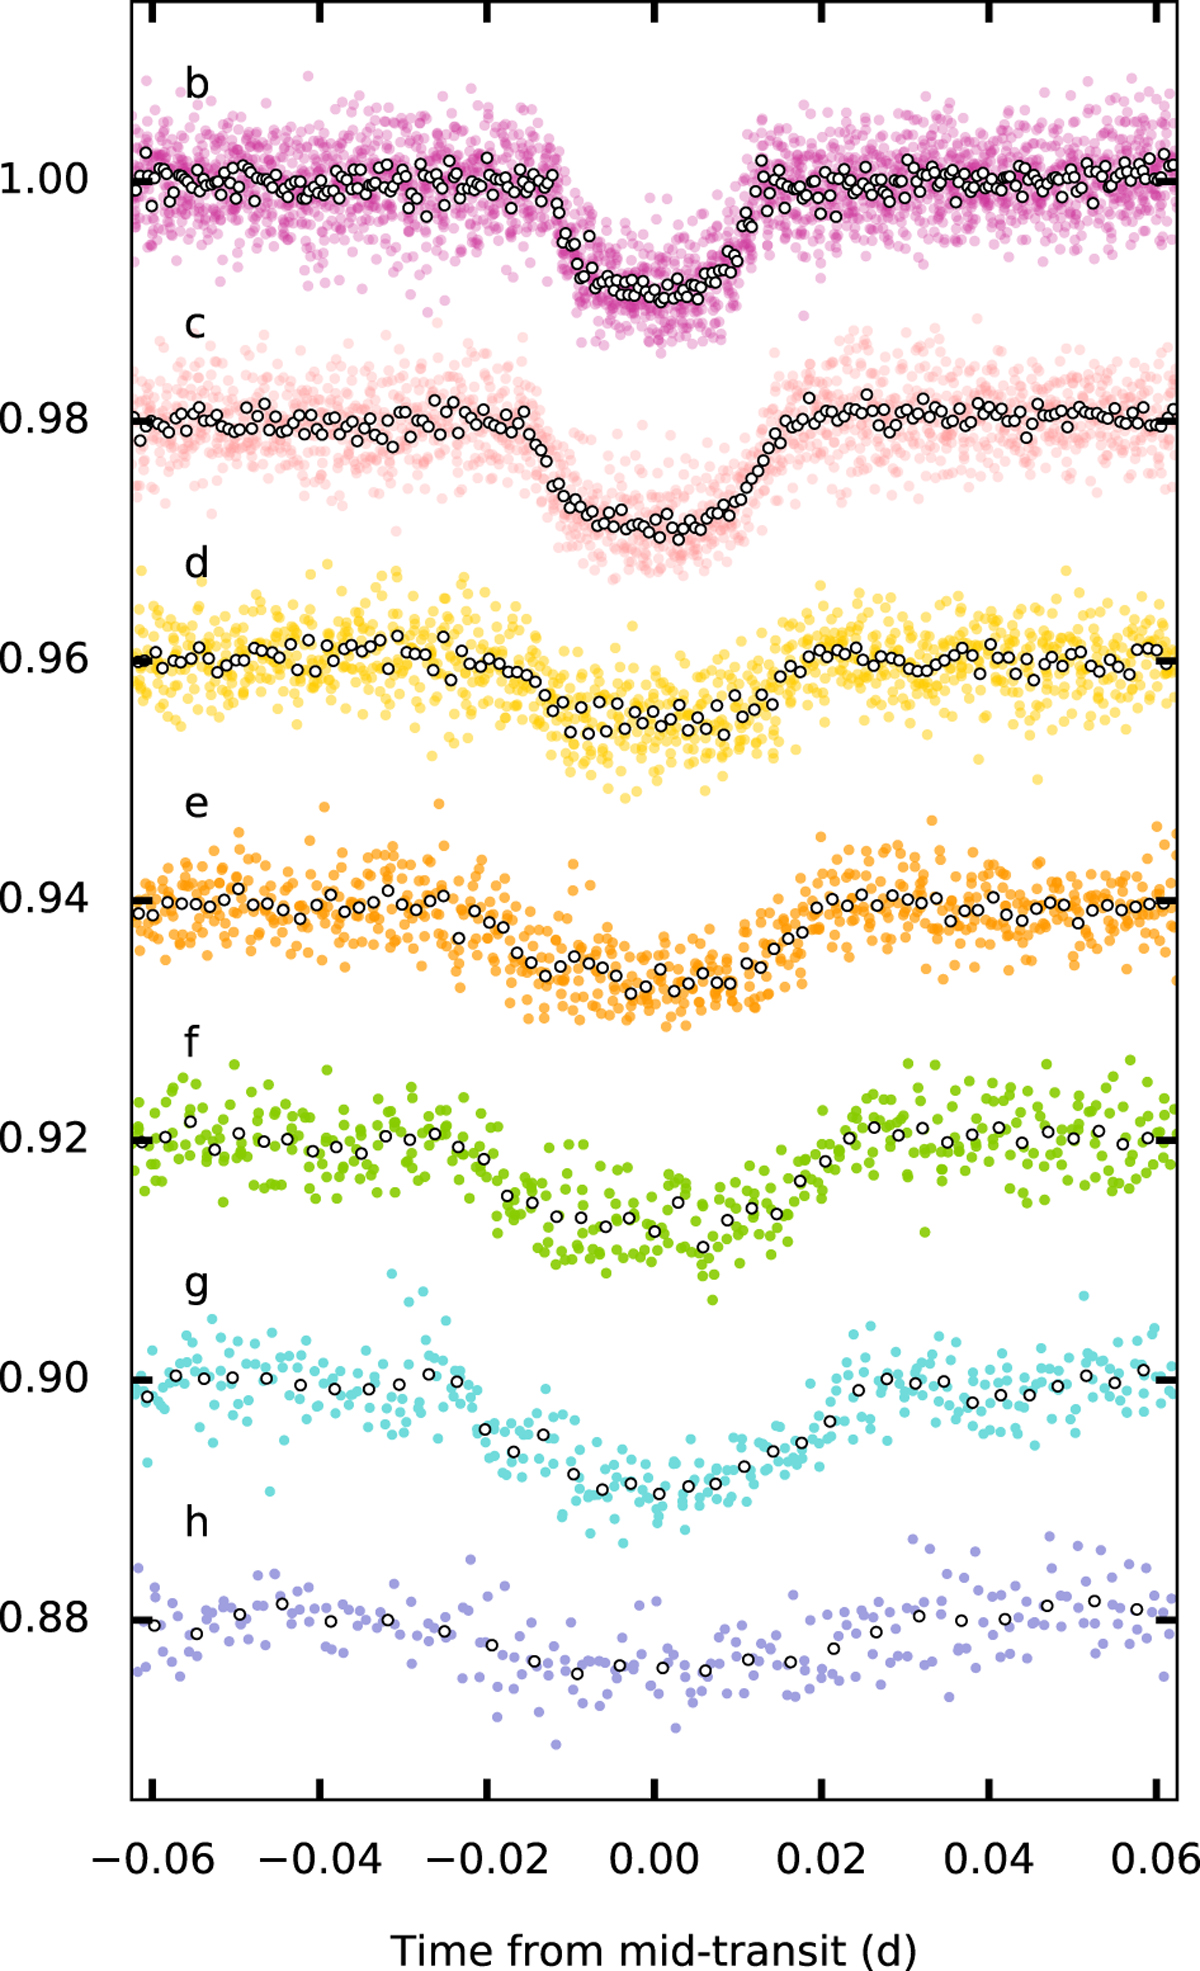
Folded short-cadence lightcurves extracted from K2 data, corrected for their corrected for their TTVs. Relative fluxes are shown for each planet and are shifted vertically for clarity. The short-cadence data are binned to produce the coloured points, with five cadences per point. The white points are further binned, with ten points taken from the folded curve per bin.
Current usage metrics show cumulative count of Article Views (full-text article views including HTML views, PDF and ePub downloads, according to the available data) and Abstracts Views on Vision4Press platform.
Data correspond to usage on the plateform after 2015. The current usage metrics is available 48-96 hours after online publication and is updated daily on week days.
Initial download of the metrics may take a while.