Fig. 7
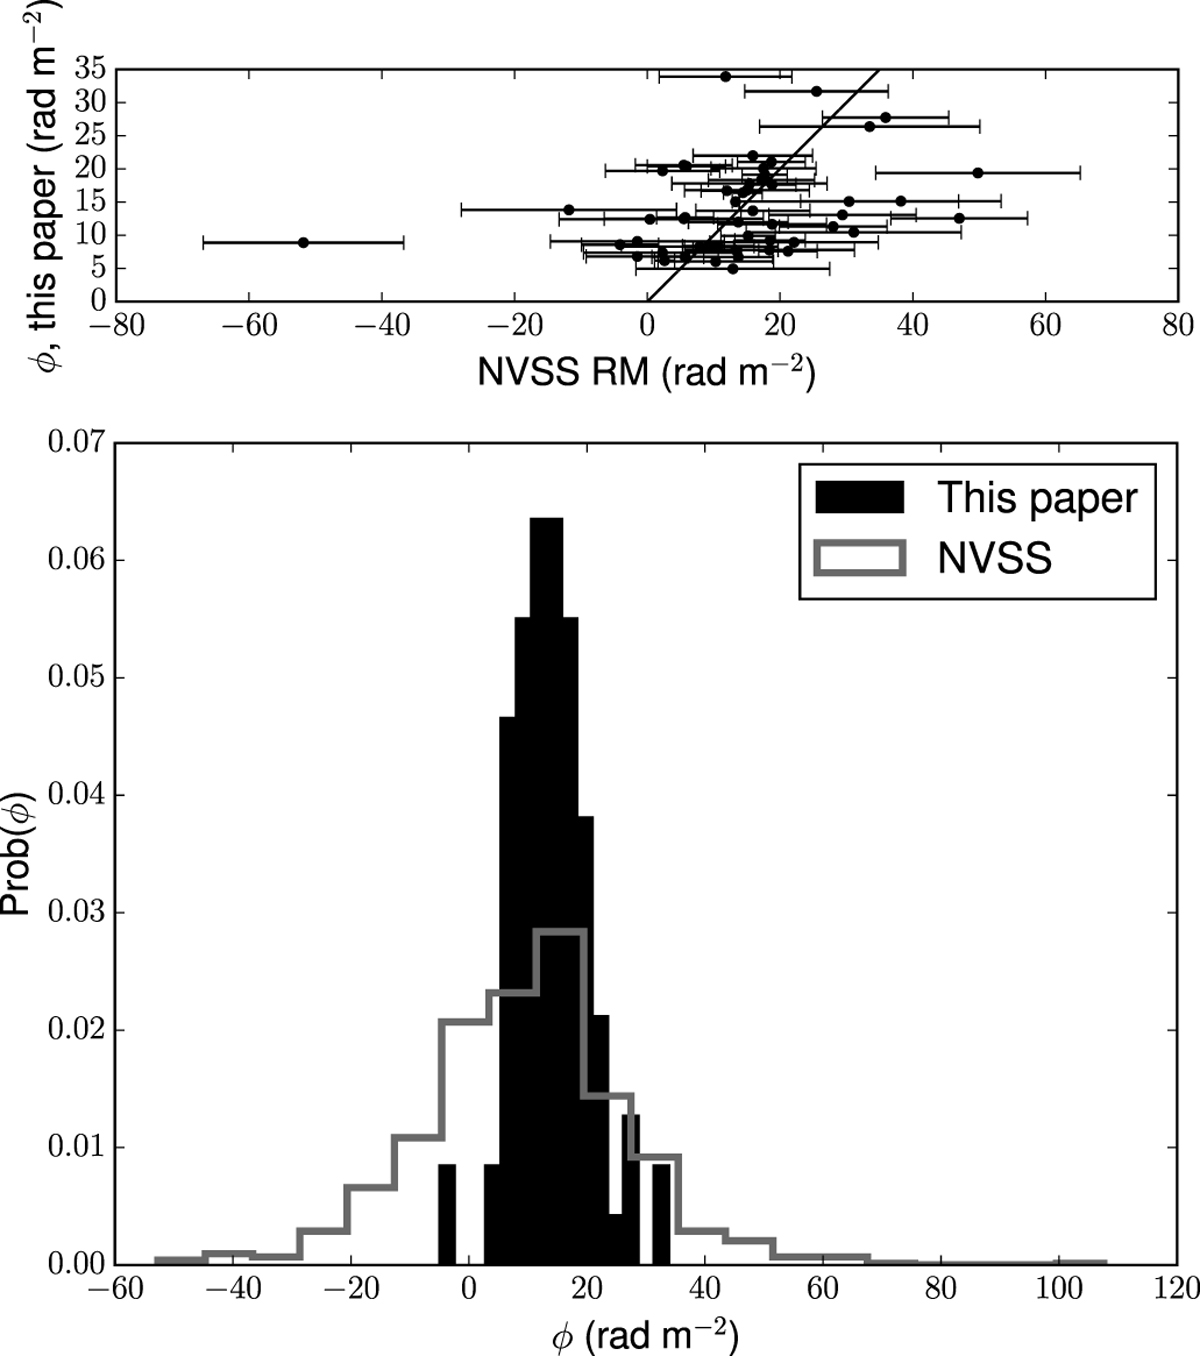
Top: A comparison of the measured Faraday depths for the 51 sources present in both our catalog and the Taylor et al. (2009) catalog. The diagonal line marks 1:1 correspondence. The errors in our measured Faraday depth are almost always much smaller than the symbol size. Bottom: The distribution of Faraday depths for our catalog and the Taylor et al. (2009) catalog. The absence of sources near 0 rad m−2 in our catalog is due to our procedure of ignoring the Faraday depths very close to the instrumental leakage.
Current usage metrics show cumulative count of Article Views (full-text article views including HTML views, PDF and ePub downloads, according to the available data) and Abstracts Views on Vision4Press platform.
Data correspond to usage on the plateform after 2015. The current usage metrics is available 48-96 hours after online publication and is updated daily on week days.
Initial download of the metrics may take a while.