Fig. 5
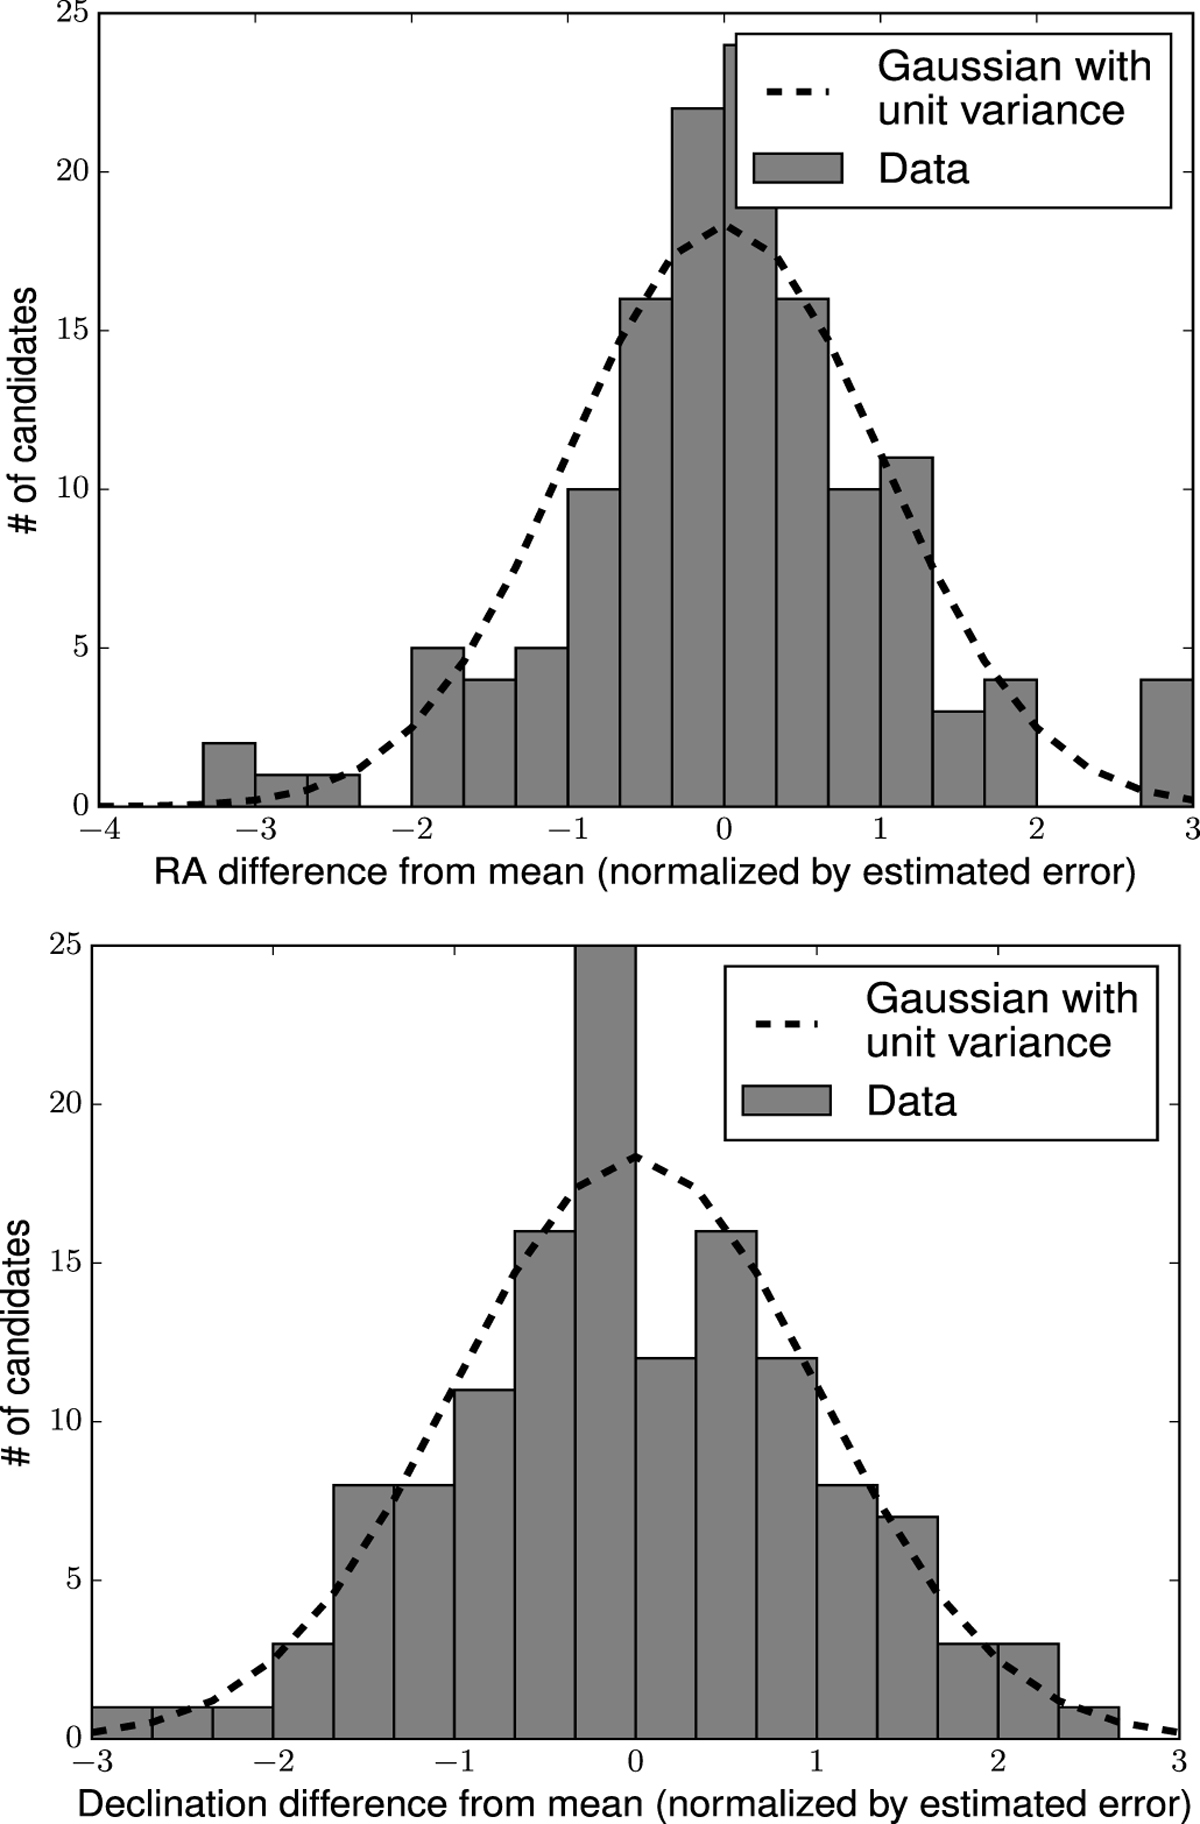
The distributions of offsets in position (right ascension (top) and declination (bottom)) from the mean for multiply-detected sources. For each source with 2 or more detections, the mean-subtracted residuals of position for each detection were calculated. The residuals were normalized by the errors calculated from the Monte Carlo noise simulations, and the resulting distributions are shown. The dashed lines are the expected distribution if the errors are correctly calculated: normal distributions with a variance of 1.0 and normalized to the total number of detections.
Current usage metrics show cumulative count of Article Views (full-text article views including HTML views, PDF and ePub downloads, according to the available data) and Abstracts Views on Vision4Press platform.
Data correspond to usage on the plateform after 2015. The current usage metrics is available 48-96 hours after online publication and is updated daily on week days.
Initial download of the metrics may take a while.