Fig. 4
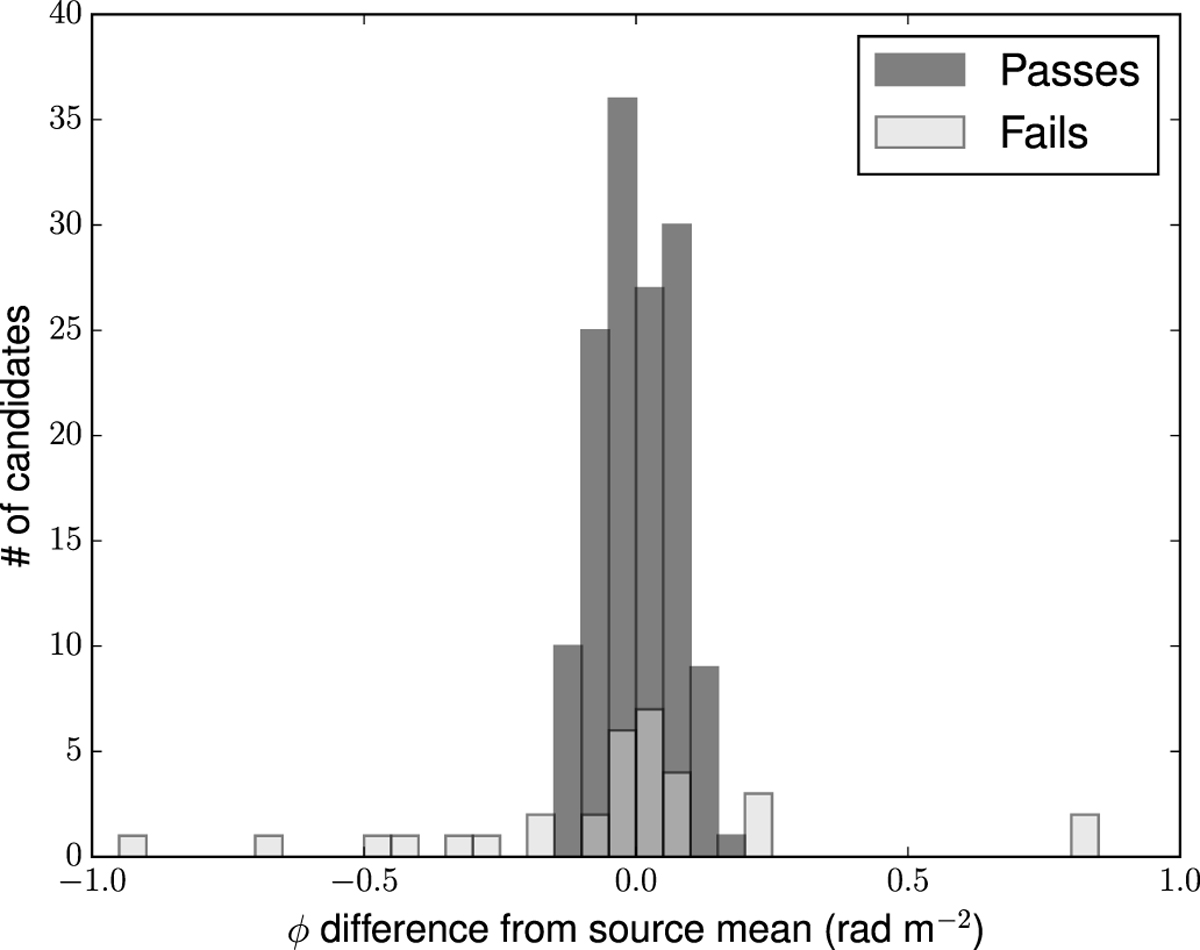
Histograms of the mean-subtracted residual Faraday depth for sources with multiple candidates from different observations, where the mean is calculated using only those observations that passed the quantitative tests (the detections). The candidates are separated by whether they passed the quantitative tests or not (each source must have at least one detection to be included).
Current usage metrics show cumulative count of Article Views (full-text article views including HTML views, PDF and ePub downloads, according to the available data) and Abstracts Views on Vision4Press platform.
Data correspond to usage on the plateform after 2015. The current usage metrics is available 48-96 hours after online publication and is updated daily on week days.
Initial download of the metrics may take a while.