Fig. 3
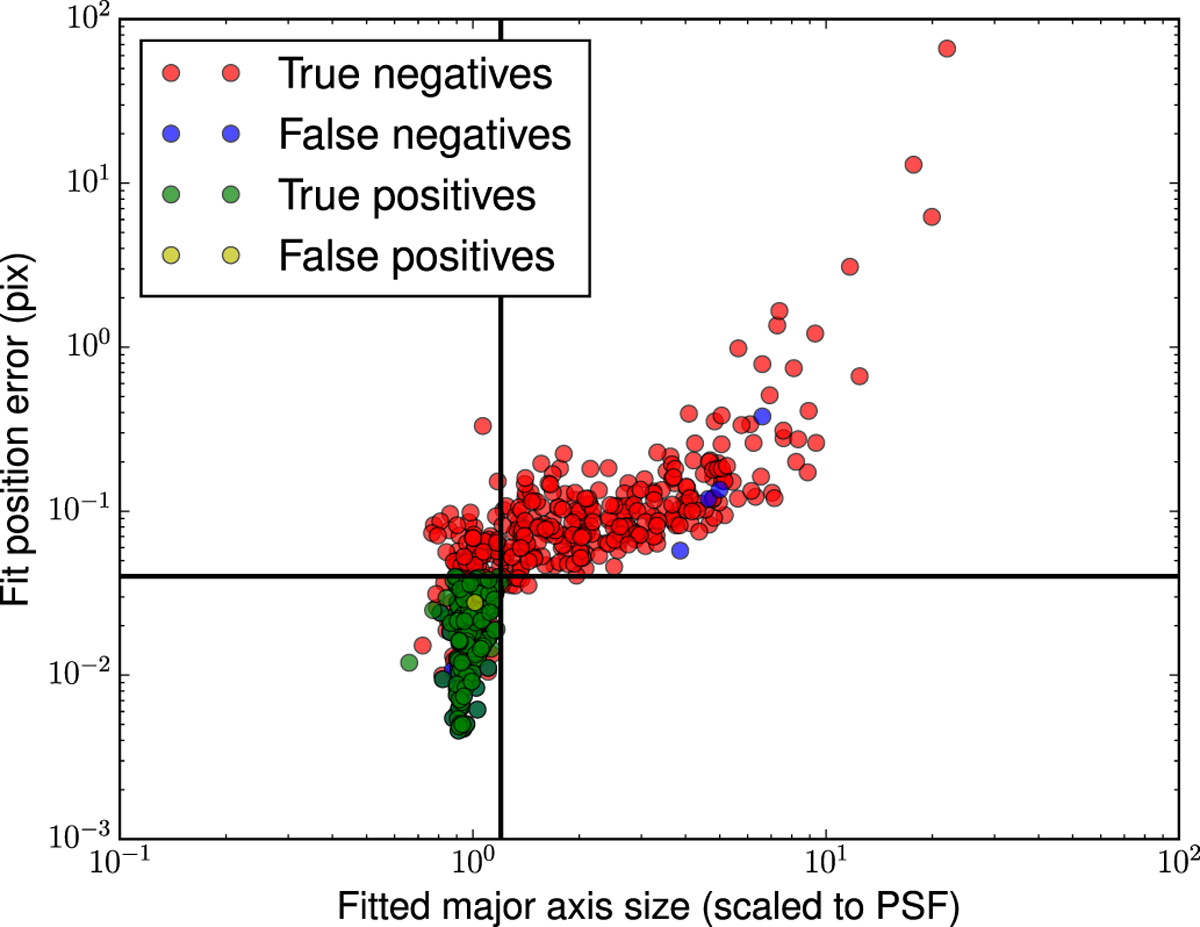
Two of the tests to determine which candidates were real: the size of the fitted major axis relative to the PSF (horizontal axis) and the error in position from the fit (vertical axis). The black lines show the test thresholds: 1.2 times the fitted major axis size and 0.04 pixels position error. Each point is a candidate peak, colored by how it was evaluated by the tests (positives passed all tests, negatives failed one or more tests, including the tests not shown) and the manual inspection (true positives/negatives where the tests match the manual inspection, false where the tests do not match the manual inspection).
Current usage metrics show cumulative count of Article Views (full-text article views including HTML views, PDF and ePub downloads, according to the available data) and Abstracts Views on Vision4Press platform.
Data correspond to usage on the plateform after 2015. The current usage metrics is available 48-96 hours after online publication and is updated daily on week days.
Initial download of the metrics may take a while.