Fig. 2
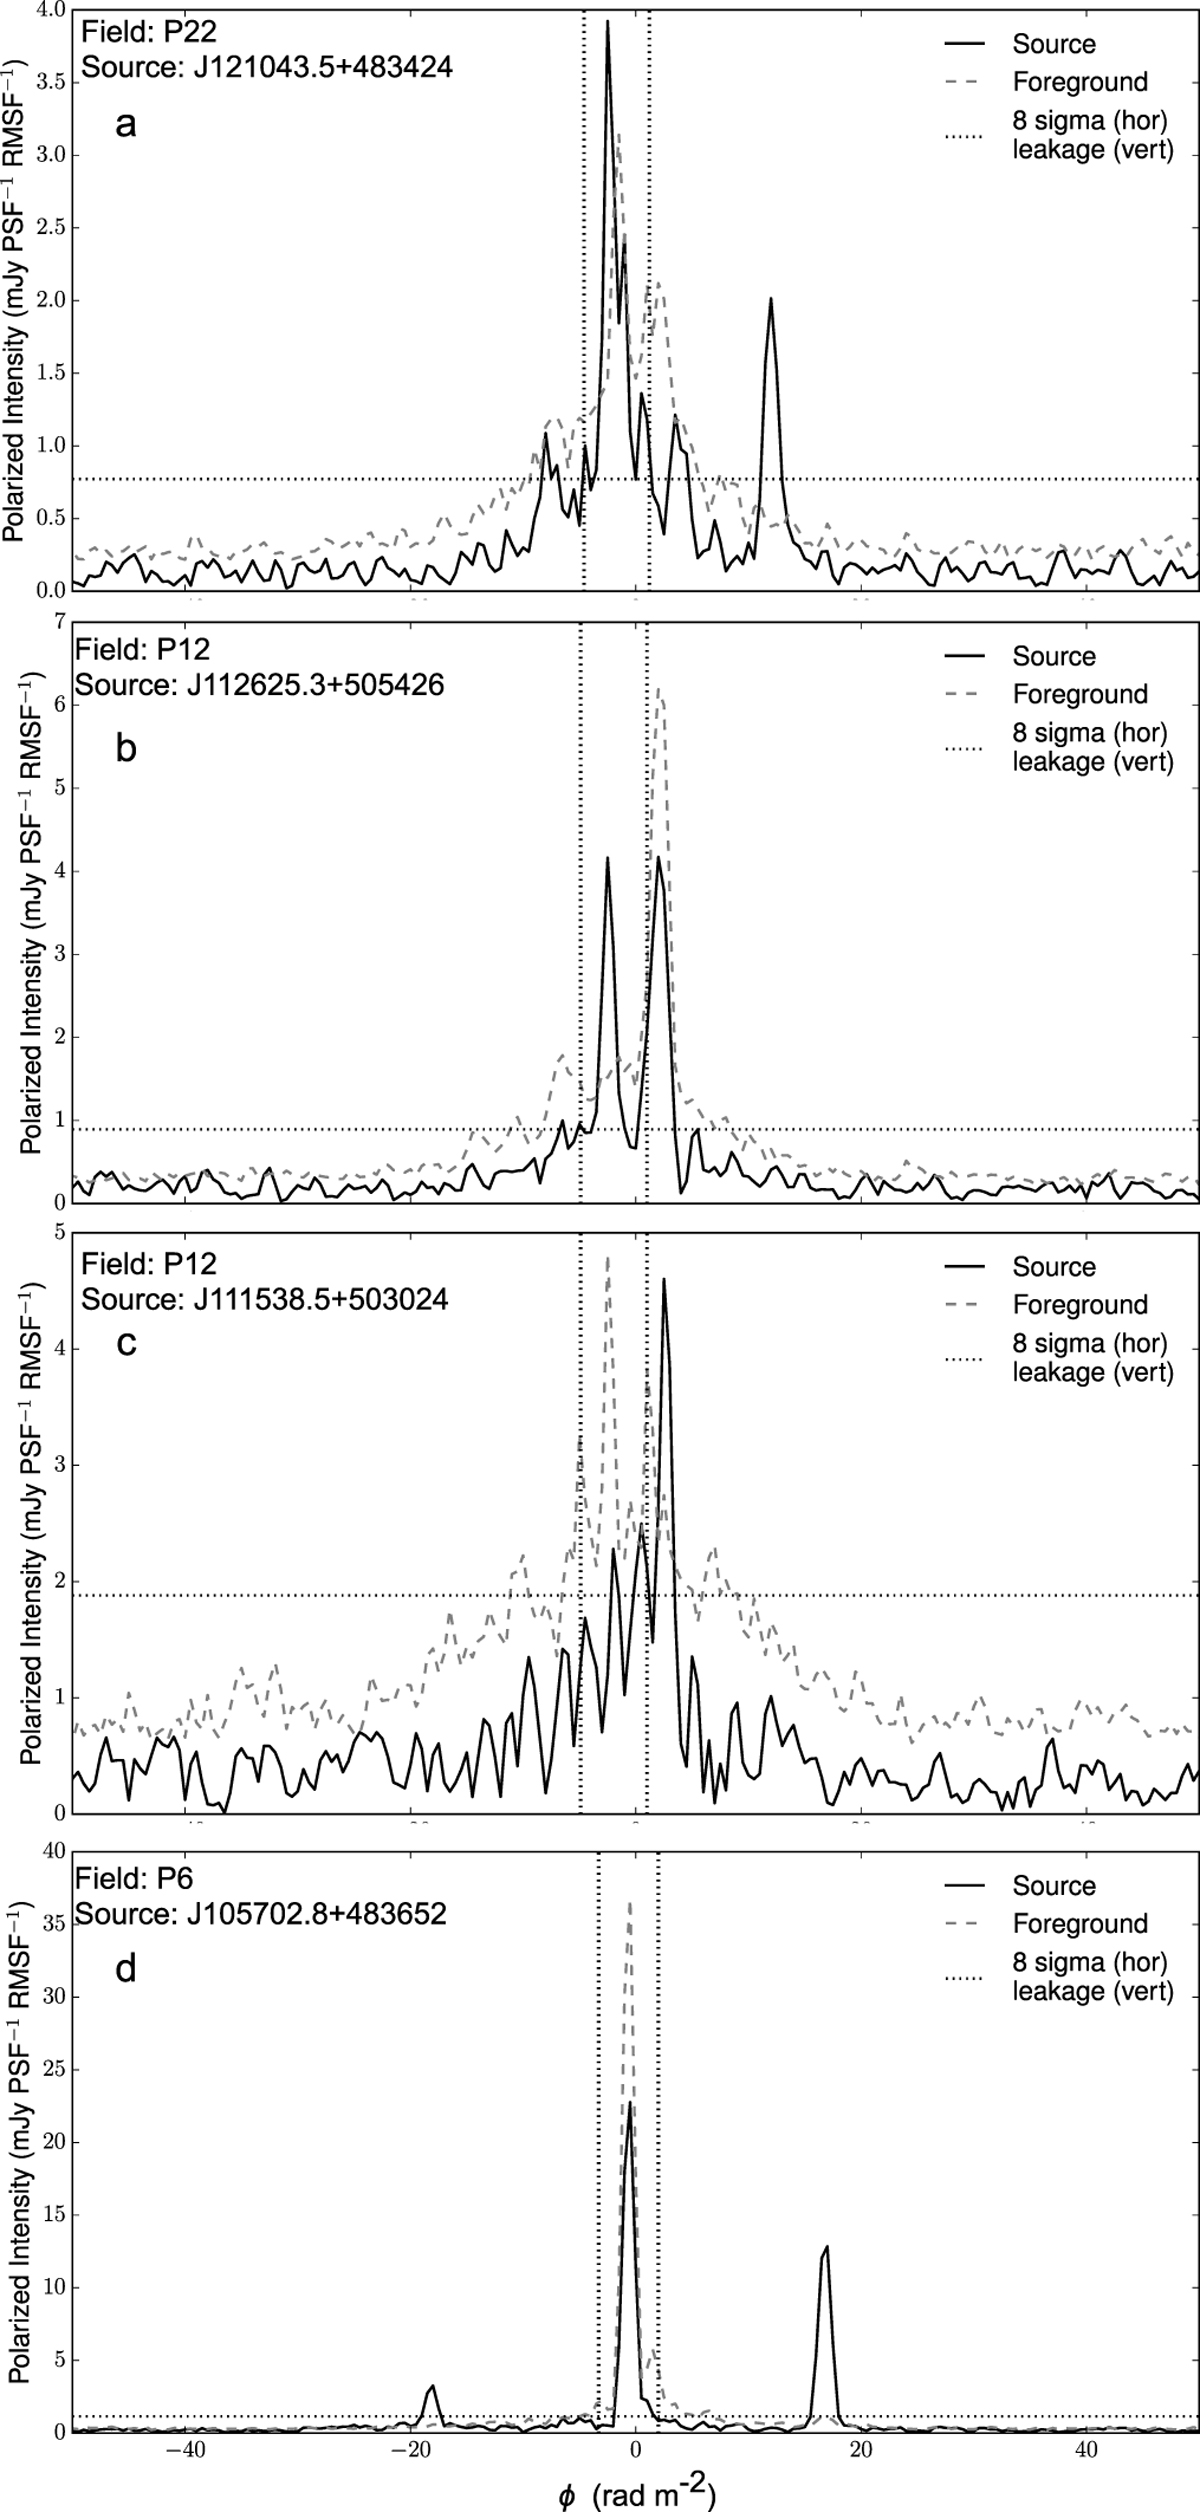
Four examples of Faraday depth spectra of different sources. For each, the source’s Faraday spectrum and foreground Faraday spectrum are shown in black and grey respectively, the 8-sigma (noise) level is marked in a horizontal dotted line, and the excluded Faraday depth range around the instrumental leakage is boundedby vertical dotted lines. The four spectra were selected to show examples of different phenomena. a) a typical detection that passed all of the tests in Sect. 2.4, with a clear bright source at +12 rad m−2; b) a non-detection with bright foreground (both on-source and off-source) at +3 rad m−2, showing the need to consider the foreground emission when identifying sources; c) a polarized candidate (which failed the tests) at +3 rad m−2, which can be seen in the full 3D cube to be a local enhancement in the foreground emission; d) a polarized source at +17 rad m−2 that passedall tests, with an artificial “mirrored” peak at −18 rad m−2 (an artifact discussed in Sect. 2.4).
Current usage metrics show cumulative count of Article Views (full-text article views including HTML views, PDF and ePub downloads, according to the available data) and Abstracts Views on Vision4Press platform.
Data correspond to usage on the plateform after 2015. The current usage metrics is available 48-96 hours after online publication and is updated daily on week days.
Initial download of the metrics may take a while.