Fig. 1
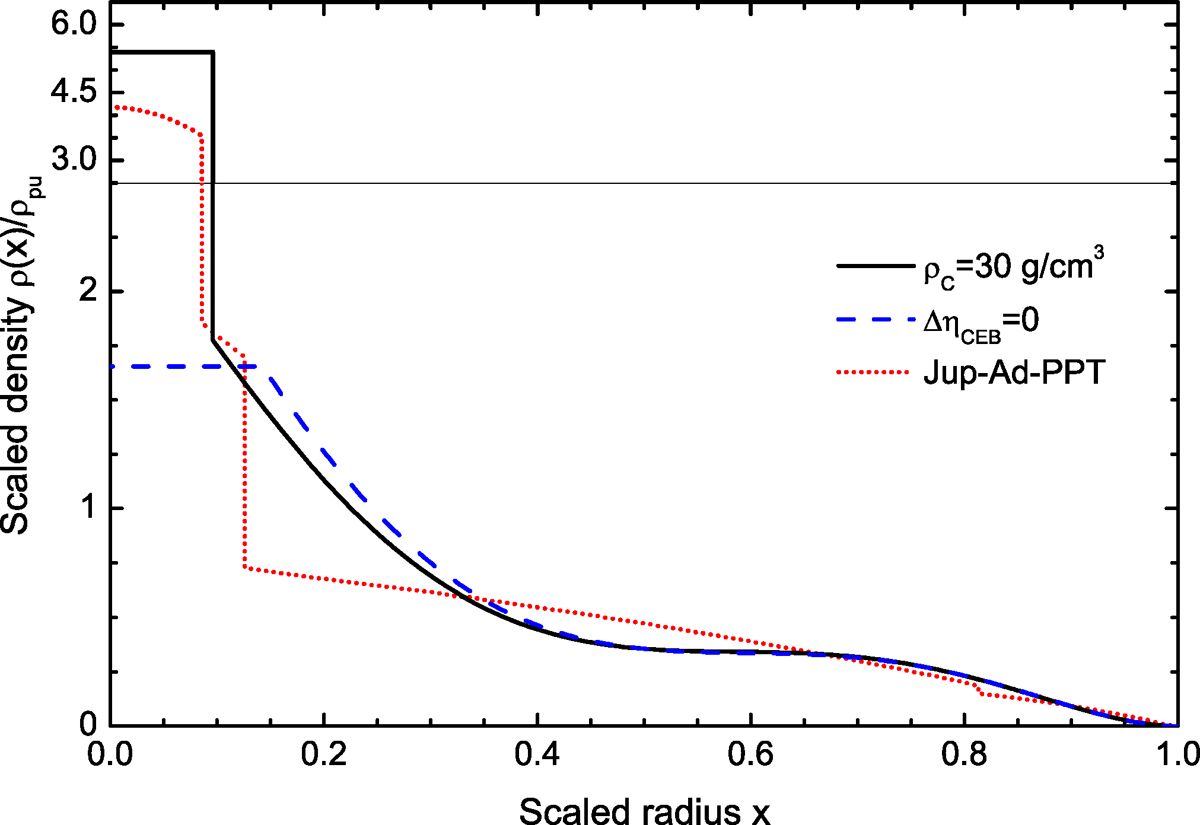
Density profiles of Jupiter models with the core mass fraction mC = 0.020. Black solid, blue dashed, and red dotted curves correspond to the maximum core density of ρC = 30 g cm-3, the zero density jump at the CEB ΔηCEB = 0, and the three-layer model of Guillot (1999; denoted by Jup-Ad-PPT), respectively. For the sake of clarity, the density values are normalized by a constant density![]() and the upper and lower parts distinguished by thin solid horizontal lines are shown in the different linear scales.
and the upper and lower parts distinguished by thin solid horizontal lines are shown in the different linear scales.
Current usage metrics show cumulative count of Article Views (full-text article views including HTML views, PDF and ePub downloads, according to the available data) and Abstracts Views on Vision4Press platform.
Data correspond to usage on the plateform after 2015. The current usage metrics is available 48-96 hours after online publication and is updated daily on week days.
Initial download of the metrics may take a while.