Fig. 6
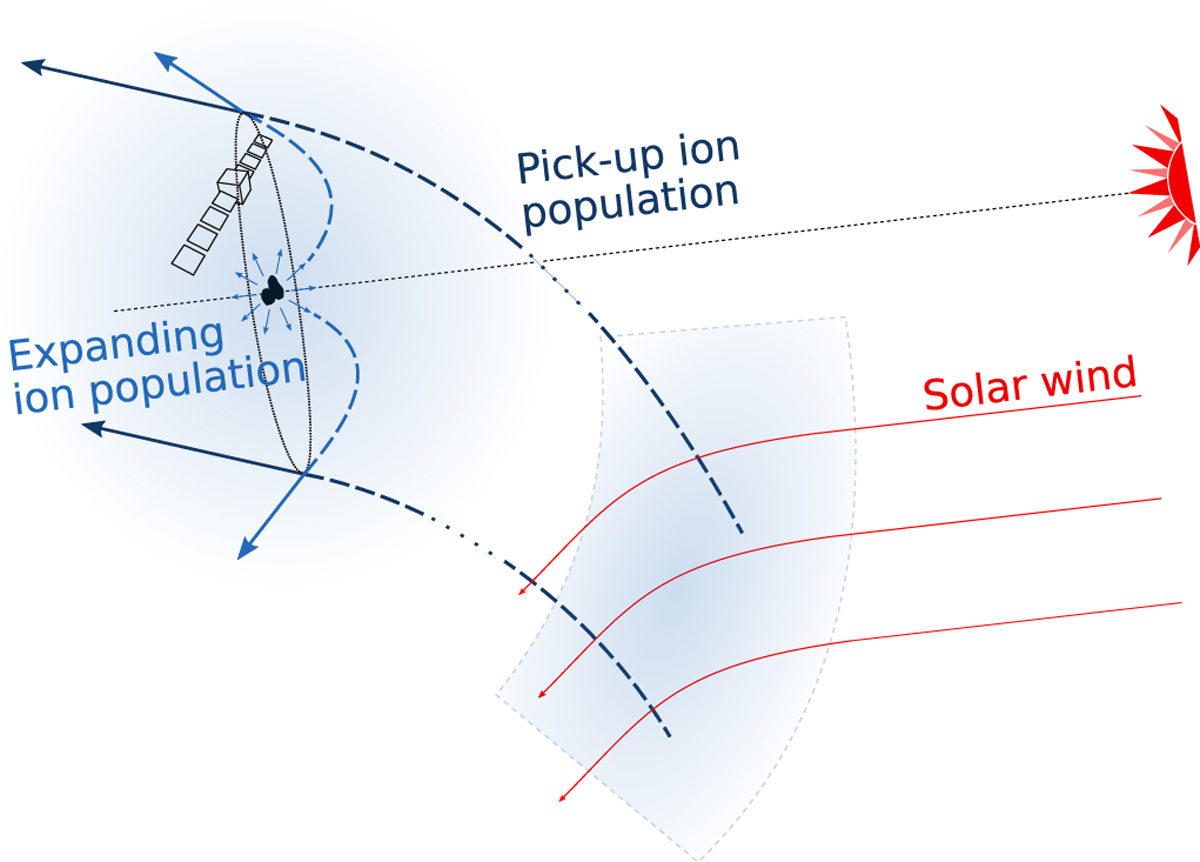
Schematics showing the inferred ion trajectories for both cometary populations. Dark blue marks the area of birth of the observed pick-up ions that are accelerated through the interaction with the solar wind. The light blue area represents the region of birth of the observed expanding ion population, which is dominated by the cometary ions. Also shown is the Rosetta spacecraft in a terminator plane orbit around the comet.
Current usage metrics show cumulative count of Article Views (full-text article views including HTML views, PDF and ePub downloads, according to the available data) and Abstracts Views on Vision4Press platform.
Data correspond to usage on the plateform after 2015. The current usage metrics is available 48-96 hours after online publication and is updated daily on week days.
Initial download of the metrics may take a while.