Fig. 2
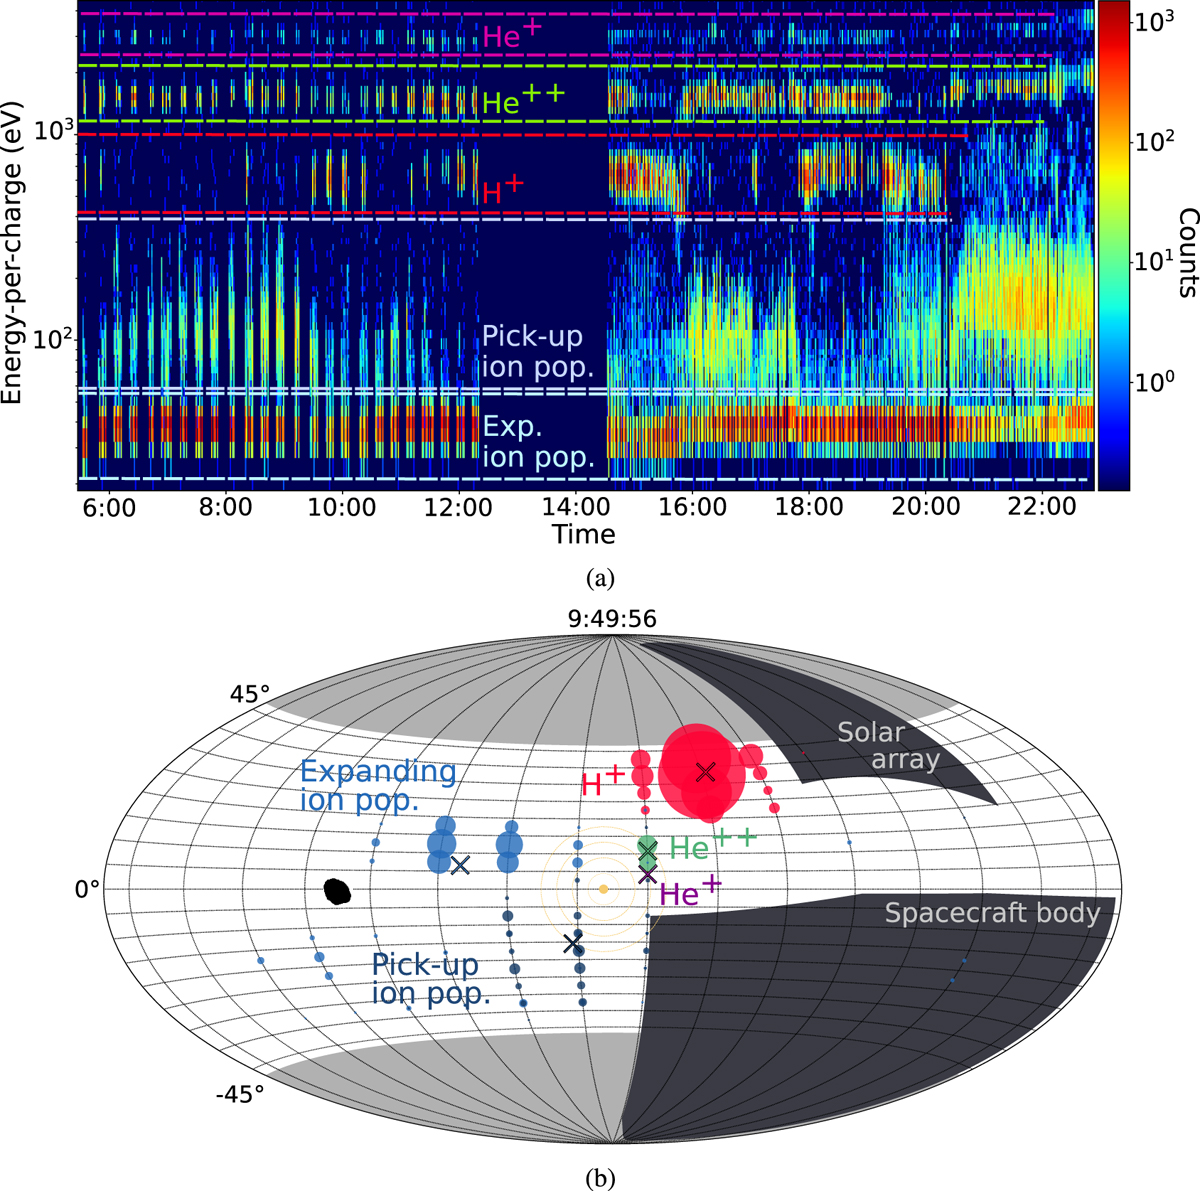
Panel a: Time energy matrix (spectrogram) produced from observations made on 13 January 2015. The marked signals at high energies are of solar origin, while at low energies we can distinguish the two ion populations: expanding and pick-up. Panel b: Scan from 13 January 2015 in a FOV representation showing arrival directions of different species. The dot sizes reflect the number of counts in each FOV unit (22.5°× 5°). The position of the Sun in the instrument frame is marked in yellow, and the grey areas show how the FOV is limited by the maximum elevation angles (–45° to 45°), and obstructed by the spacecraft. In black we show the projection of the comet in the RPC-ICA field of view (ESA NavCam shape model).
Current usage metrics show cumulative count of Article Views (full-text article views including HTML views, PDF and ePub downloads, according to the available data) and Abstracts Views on Vision4Press platform.
Data correspond to usage on the plateform after 2015. The current usage metrics is available 48-96 hours after online publication and is updated daily on week days.
Initial download of the metrics may take a while.