Open Access
Fig. 1
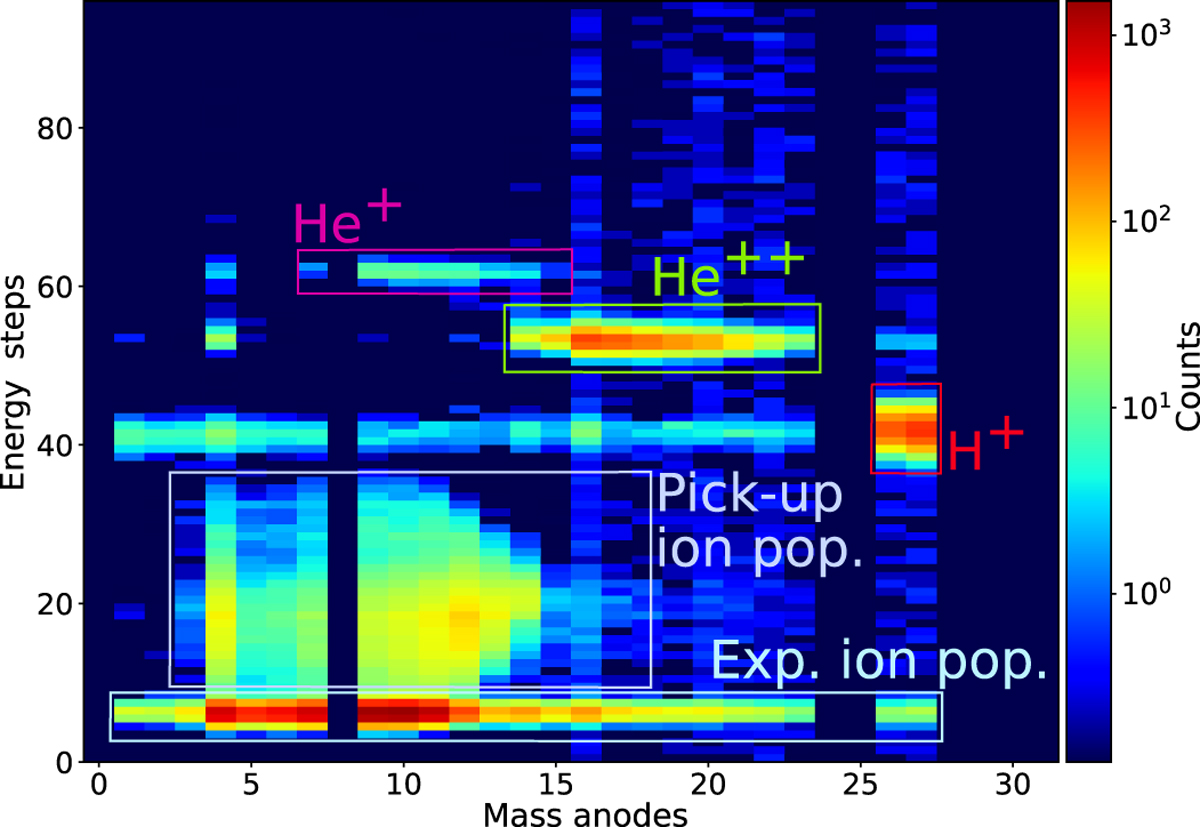
Daily mass energy matrix showing an example of visual species identification for 13 January 2015. The number of counts in each pixel is colour-coded: red indicates the most counts, and blue the least or 0. Mass anodes 0, 24, 25, 28, 29, 30, and 31 are non-operational, showing 0 counts in the plot.
Current usage metrics show cumulative count of Article Views (full-text article views including HTML views, PDF and ePub downloads, according to the available data) and Abstracts Views on Vision4Press platform.
Data correspond to usage on the plateform after 2015. The current usage metrics is available 48-96 hours after online publication and is updated daily on week days.
Initial download of the metrics may take a while.