Fig. 7
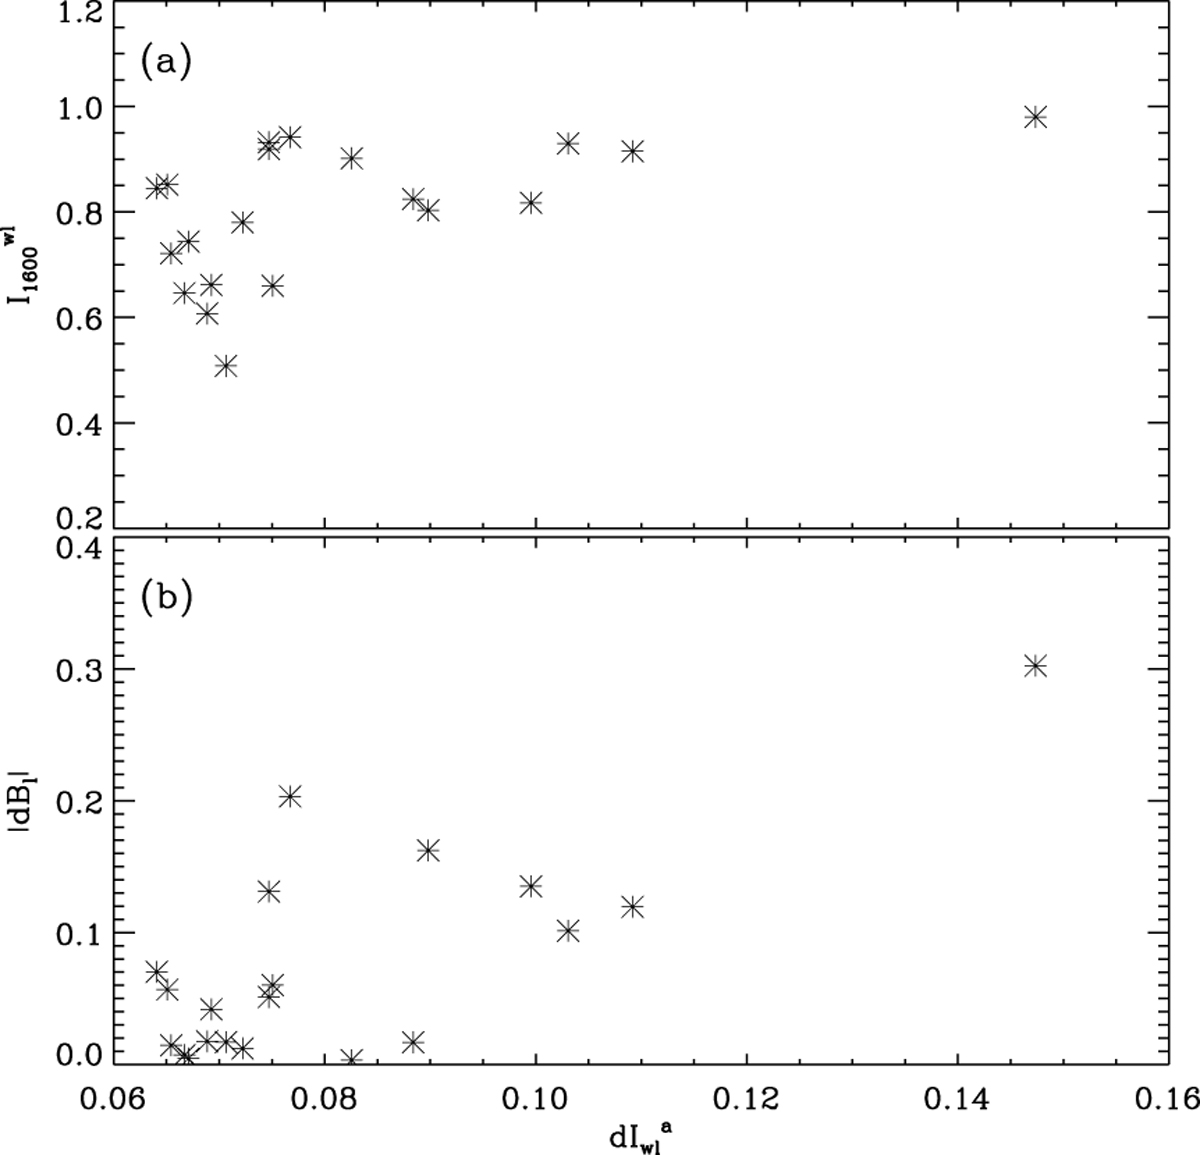
Panel a: relationship between WL enhancement (![]() , the average enhancement of WL emission in the WLF region) and AIA 1600 Å intensity (
, the average enhancement of WL emission in the WLF region) and AIA 1600 Å intensity (![]() , the ratio between the average AIA 1600 Å intensity in the WLF region and the maximum 1600 Å intensity in the whole flare region) for 20 WLFs in NOAA AR 11515. The positive correlation indicates that a WLF has a stronger WL emission if it occurs closer to the center of the whole flaring region. Panel b: relationship between WL enhancement (
, the ratio between the average AIA 1600 Å intensity in the WLF region and the maximum 1600 Å intensity in the whole flare region) for 20 WLFs in NOAA AR 11515. The positive correlation indicates that a WLF has a stronger WL emission if it occurs closer to the center of the whole flaring region. Panel b: relationship between WL enhancement (![]() ) and magnetic field change (|dBl|, the absolute change of the unsigned Bl
in WLF region). A greater enhancement of the WL emission is often accompanied by a greater change in the line-of-sight magnetic field.
) and magnetic field change (|dBl|, the absolute change of the unsigned Bl
in WLF region). A greater enhancement of the WL emission is often accompanied by a greater change in the line-of-sight magnetic field.
Current usage metrics show cumulative count of Article Views (full-text article views including HTML views, PDF and ePub downloads, according to the available data) and Abstracts Views on Vision4Press platform.
Data correspond to usage on the plateform after 2015. The current usage metrics is available 48-96 hours after online publication and is updated daily on week days.
Initial download of the metrics may take a while.