Fig. 6
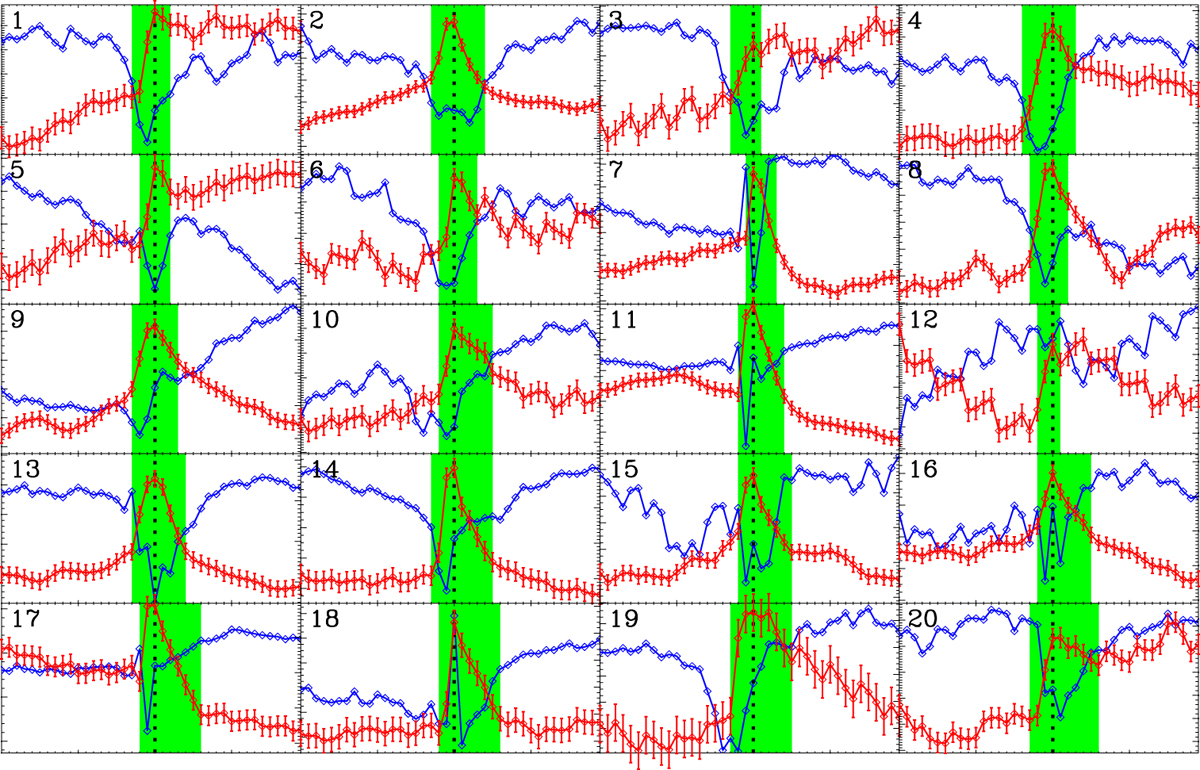
Temporal evolution of the HMI continuum (red) and unsigned Bl (line-of-sight magnetic field, blue) for the 20 WLFs. The black dotted line marks the time of the WL emission peak for each WLF. The green shaded region marks the duration of each WLF. The time range shown in each panel is from 25 min before the peak time to 25 min after it.
Current usage metrics show cumulative count of Article Views (full-text article views including HTML views, PDF and ePub downloads, according to the available data) and Abstracts Views on Vision4Press platform.
Data correspond to usage on the plateform after 2015. The current usage metrics is available 48-96 hours after online publication and is updated daily on week days.
Initial download of the metrics may take a while.