Fig. 5
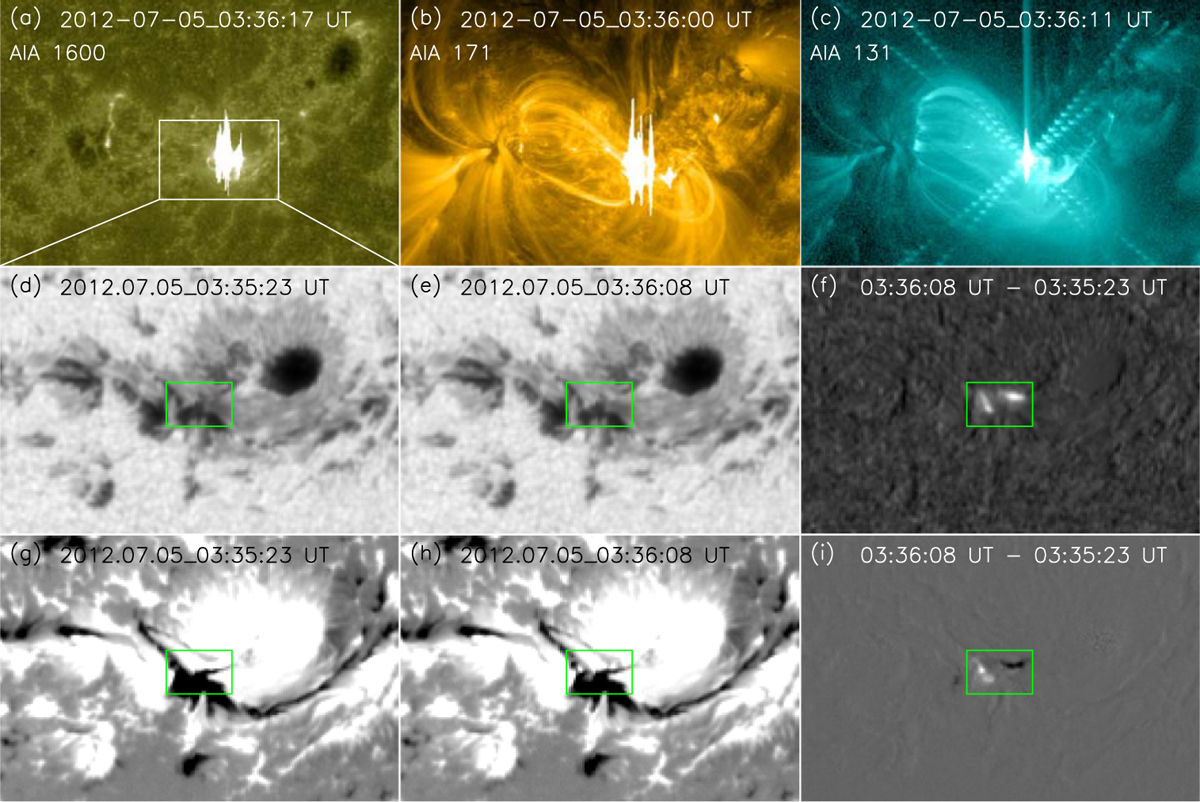
WLF in NOAA AR 11515. Panels a, b, and c are AIA 1600, 171, and 131 Å images at the peak time of this WLF, respectively. Panels d and e are HMI continuum images at the beginning and peaktime of this WLF, respectively. Panel f is the difference image between (d) and (e). Panels g and h are HMI line-of-sight magnetograms at the beginning and peak time of this WLF, respectively. Panel i is the difference image between (g) and (h). The white box in panel a corresponds to the FOV in panels d–i. The green box in panels d–i marks the location where the flare occurred.
Current usage metrics show cumulative count of Article Views (full-text article views including HTML views, PDF and ePub downloads, according to the available data) and Abstracts Views on Vision4Press platform.
Data correspond to usage on the plateform after 2015. The current usage metrics is available 48-96 hours after online publication and is updated daily on week days.
Initial download of the metrics may take a while.