Fig. 2
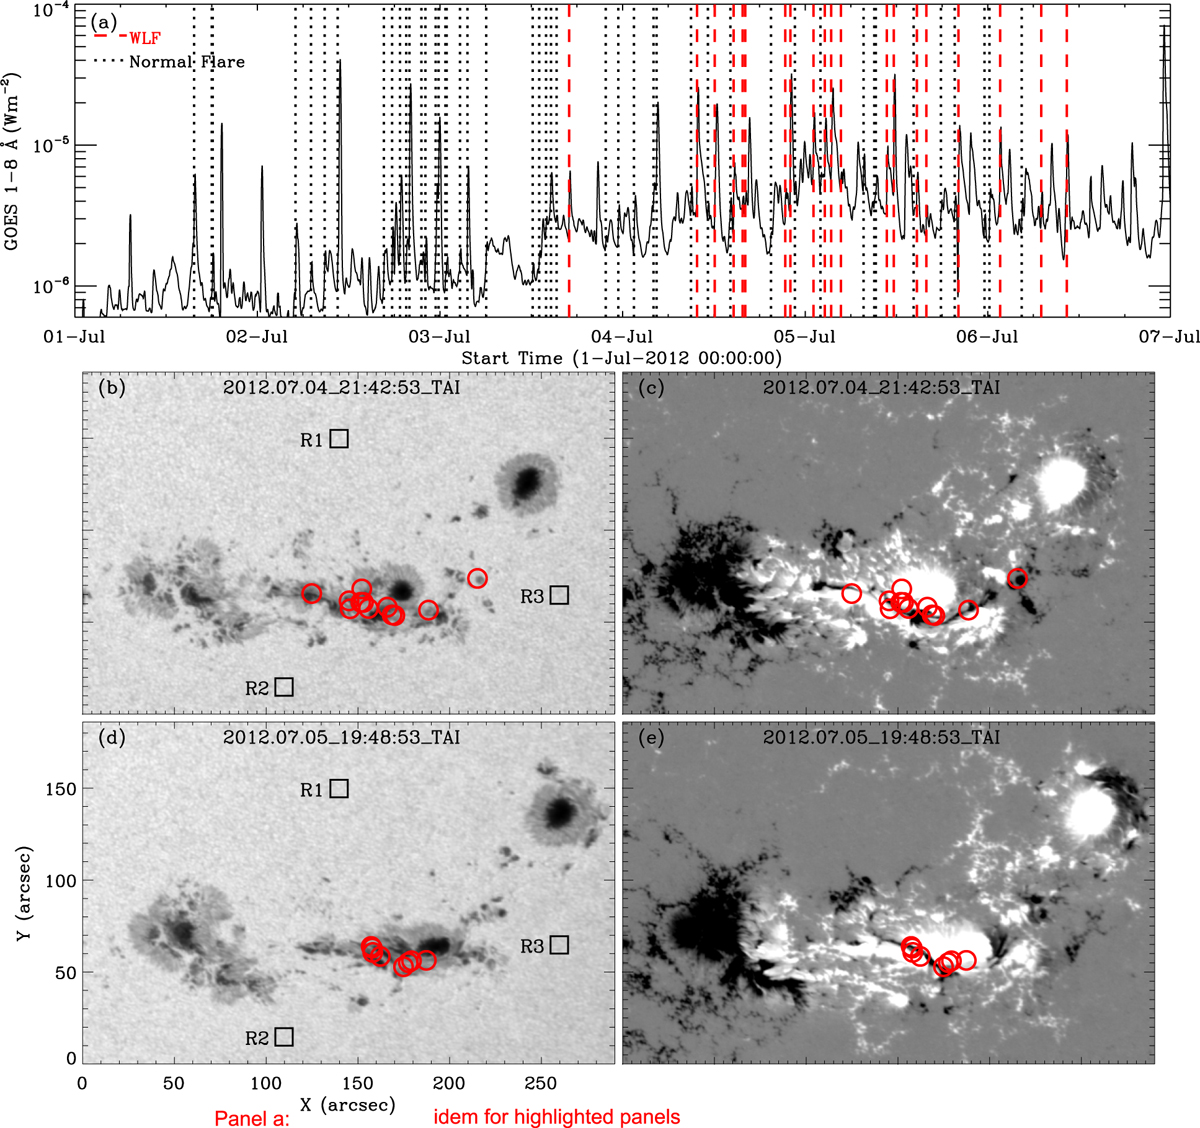
WLFs in NOAA AR 11515. Panel a: 70 flares (C- and M-classes) occurred between E45° and W45°. The solid line is GOES soft X-ray (1–8 Å). The red dashed lines mark the peak times of WLFs, and the black dotted lines mark the peak times of normal flares. Panels b–e: locations of these WLFs in the active region. The circles in panels b and c show WLFs 1–12, while the circles in panels d and e show WLFs 13–20. Panels b and d: HMI continuum images at two different times, panels c and e: HMI line-of-sight magnetograms at two different times. The black boxes R1, R2, and R3 in panels b and d mark the quiet-Sun regions we selected to estimate the error in the measured continuum intensity. The size of each box is 20 × 20 pixels.
Current usage metrics show cumulative count of Article Views (full-text article views including HTML views, PDF and ePub downloads, according to the available data) and Abstracts Views on Vision4Press platform.
Data correspond to usage on the plateform after 2015. The current usage metrics is available 48-96 hours after online publication and is updated daily on week days.
Initial download of the metrics may take a while.