Free Access
Fig. 1
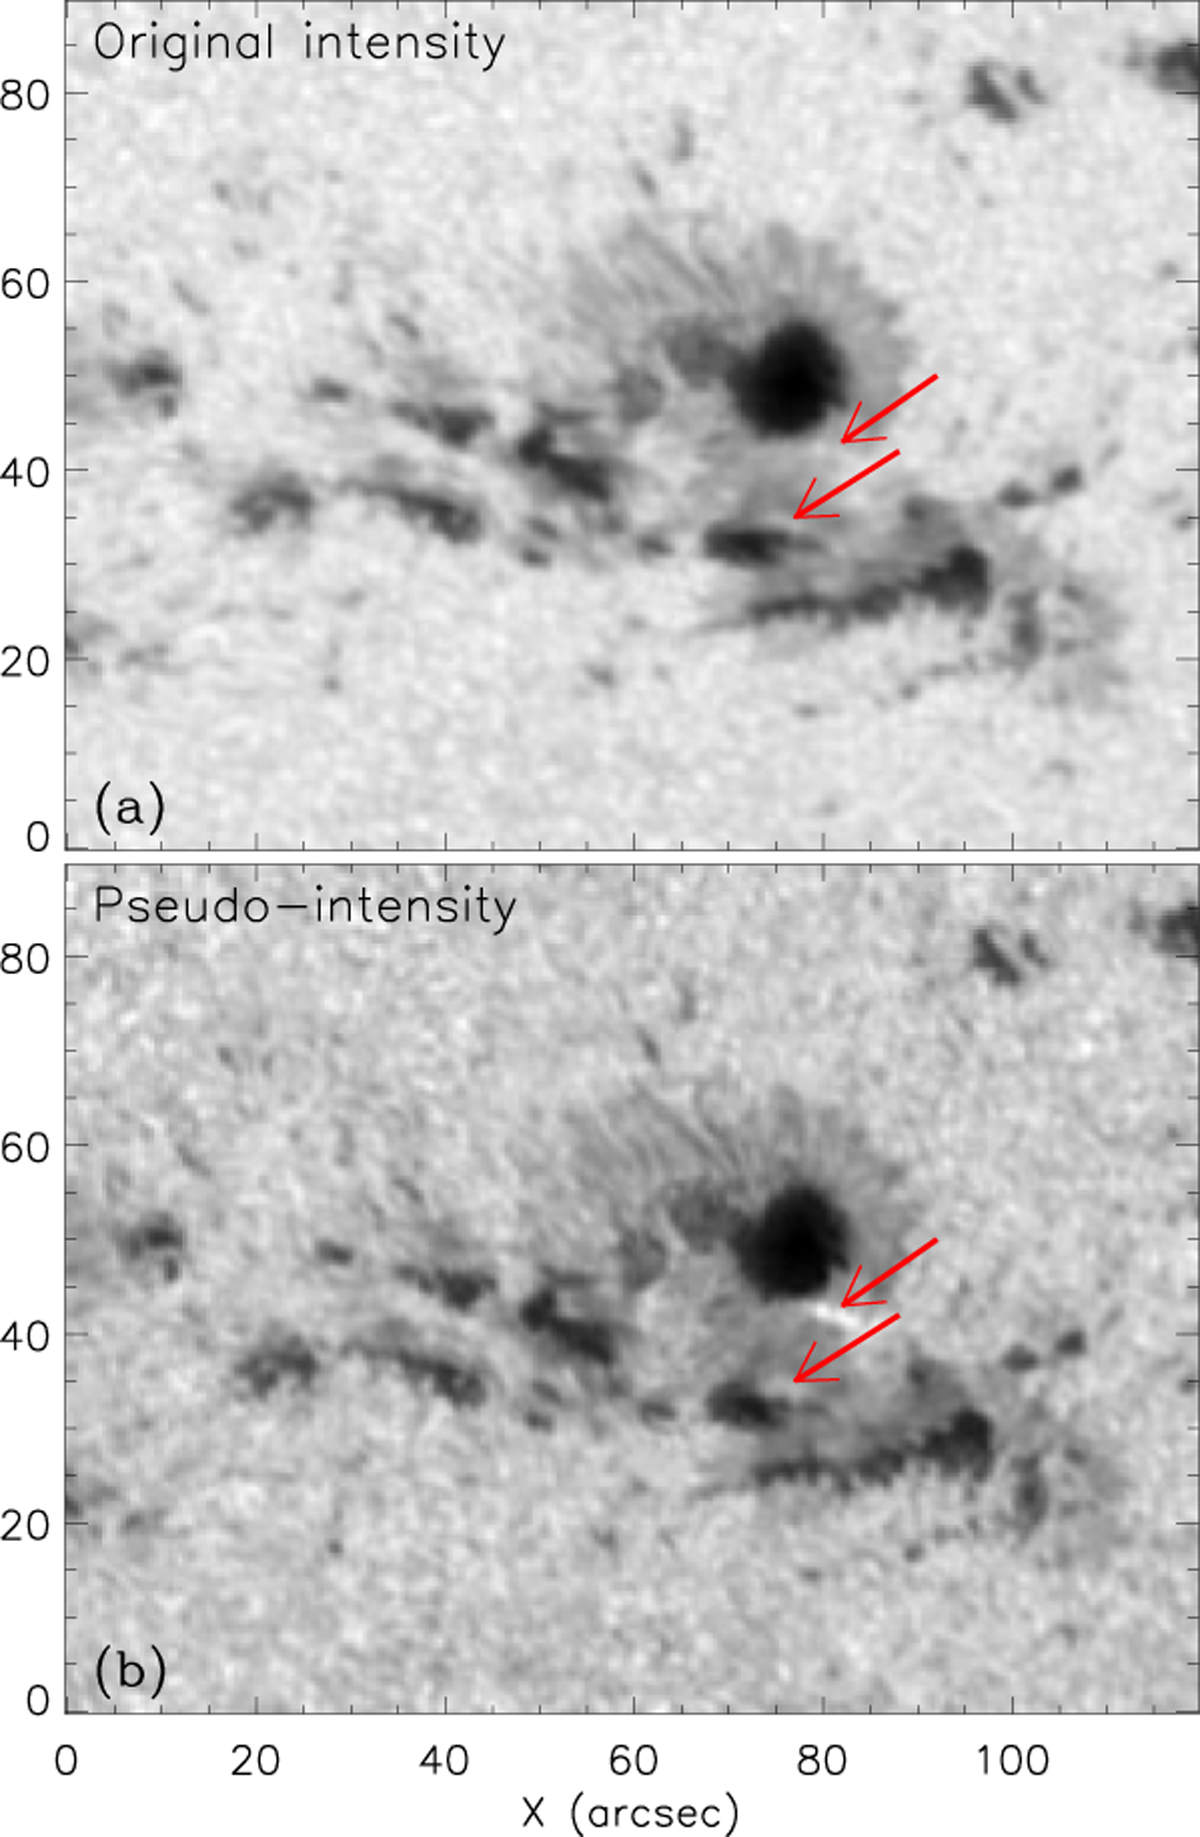
HMI continuum intensity images of an M5.3 WLF observed at 09:54:53 UT on July 4, 2012. Panel a: normal intensity; panel b: pseudo-intensity. Red arrows point out the regions where the WL enhancements occurred. (An animation of this figure is available.)
Current usage metrics show cumulative count of Article Views (full-text article views including HTML views, PDF and ePub downloads, according to the available data) and Abstracts Views on Vision4Press platform.
Data correspond to usage on the plateform after 2015. The current usage metrics is available 48-96 hours after online publication and is updated daily on week days.
Initial download of the metrics may take a while.