Fig. 5
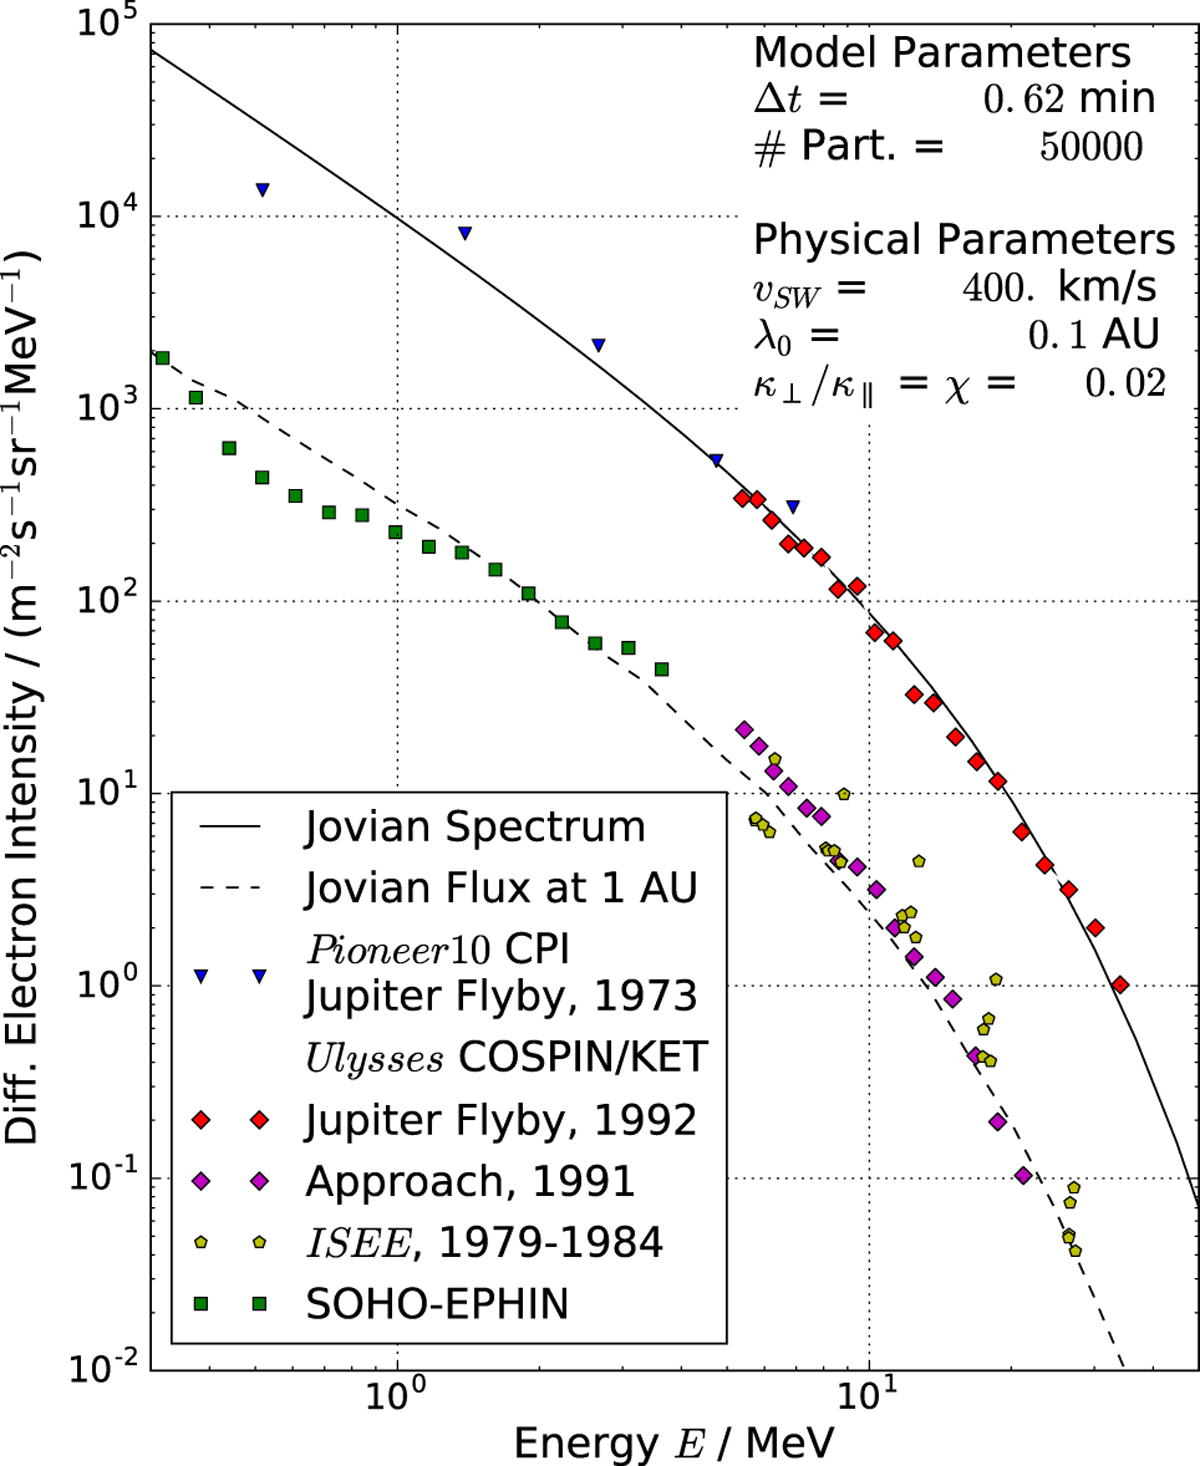
New Jovian source spectrum (solid line) and the corresponding simulated intensities at the Earth’s orbit (dashed line) at times of good magnetic connectivity to the source. Additional to the flyby spectra obtained by Pioneer 10 CPI and UlyssesCOSPIN-KET which were introduced to derive the source, here also the spectral data by SOHO-EPHIN (green), ISEE 3 (yellow), and the Ulysses COSPIN-KET (violet) data measured shortly after the launch are displayed, as documented in Table 1. While the SOHO-EPHIN spectrum is sampled over several time periods of good magnetic connectivity with the source, due to reasons explained in Sect. 3.2 the spectra obtained by ISEE 3 have to be included separately.
Current usage metrics show cumulative count of Article Views (full-text article views including HTML views, PDF and ePub downloads, according to the available data) and Abstracts Views on Vision4Press platform.
Data correspond to usage on the plateform after 2015. The current usage metrics is available 48-96 hours after online publication and is updated daily on week days.
Initial download of the metrics may take a while.