Fig. 4
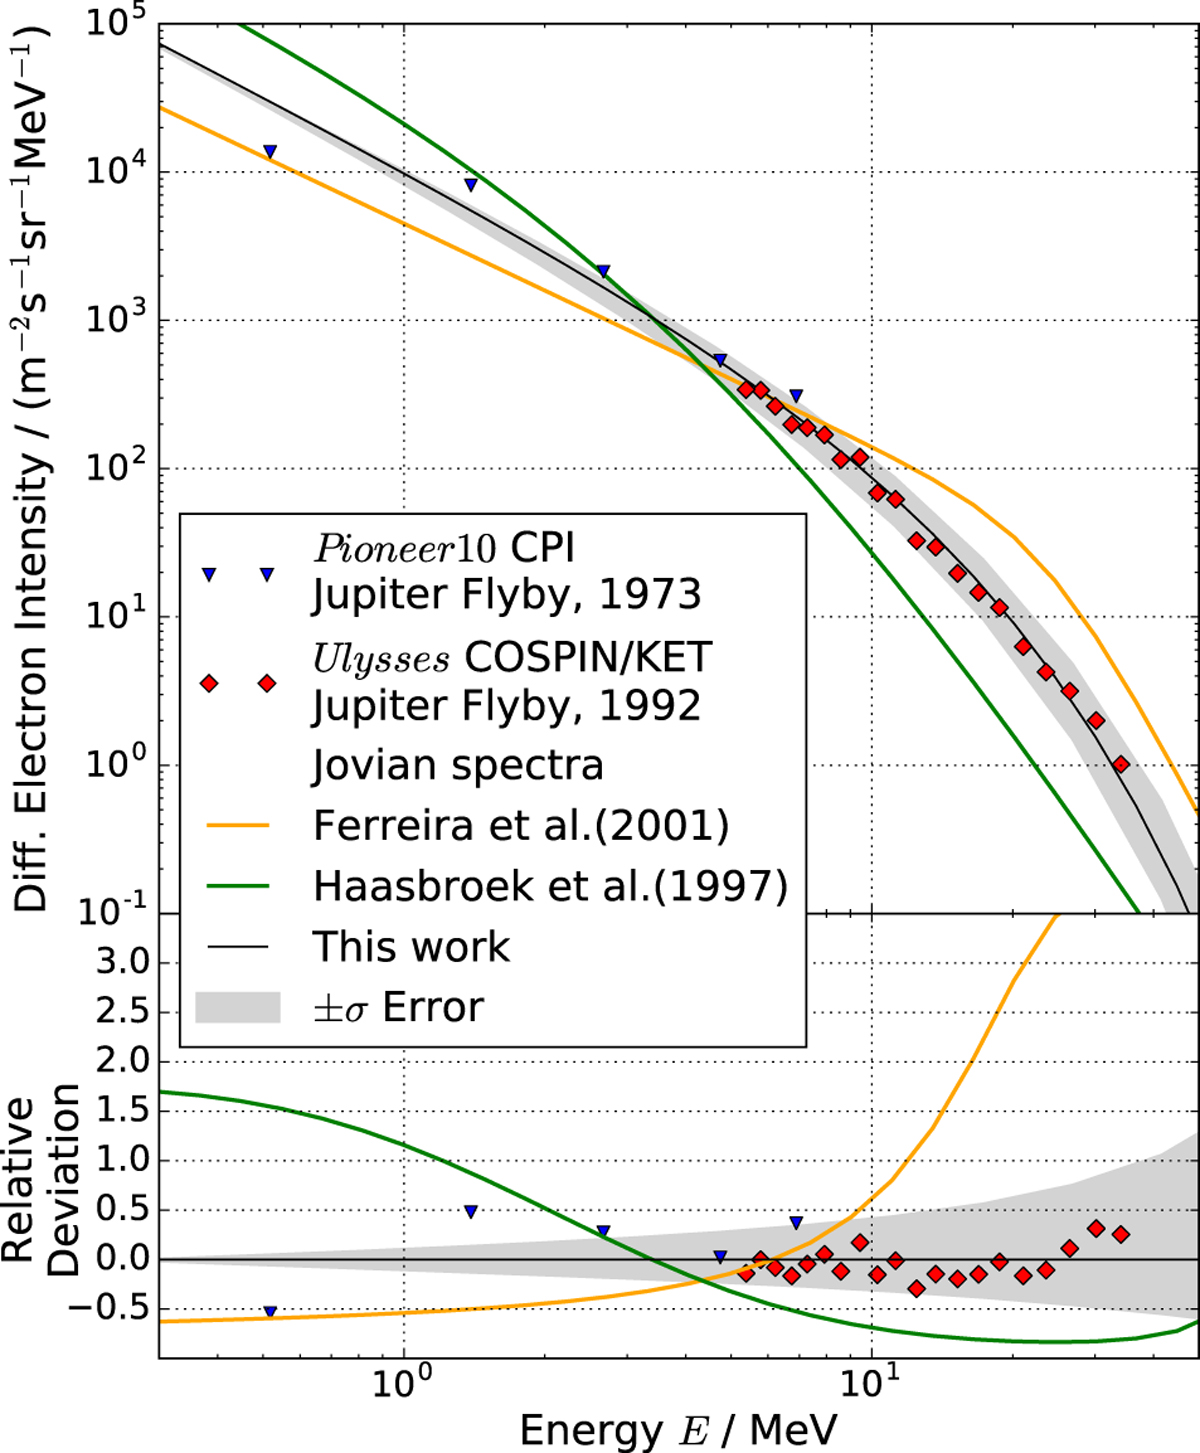
New source spectrum alongside that by Ferreira et al. (2001) in orange and the suggestion by Haasbroek et al. (1997; green) as discussed in Sect. 4. In the upper panel all three spectra are shown alongside the Jovian flyby data and the 1 σ error region surrounding our estimation. The lower panel shows the relative deviation of the estimations, calculated as (jprevious− jnew)∕jnew. Especially inthe energy range above Ebreak = 9.4 MeV the lower panel shows how the deviation increases up to over 100% and even far more for the spectrum by Ferreira et al. (2001).
Current usage metrics show cumulative count of Article Views (full-text article views including HTML views, PDF and ePub downloads, according to the available data) and Abstracts Views on Vision4Press platform.
Data correspond to usage on the plateform after 2015. The current usage metrics is available 48-96 hours after online publication and is updated daily on week days.
Initial download of the metrics may take a while.