Fig. 4
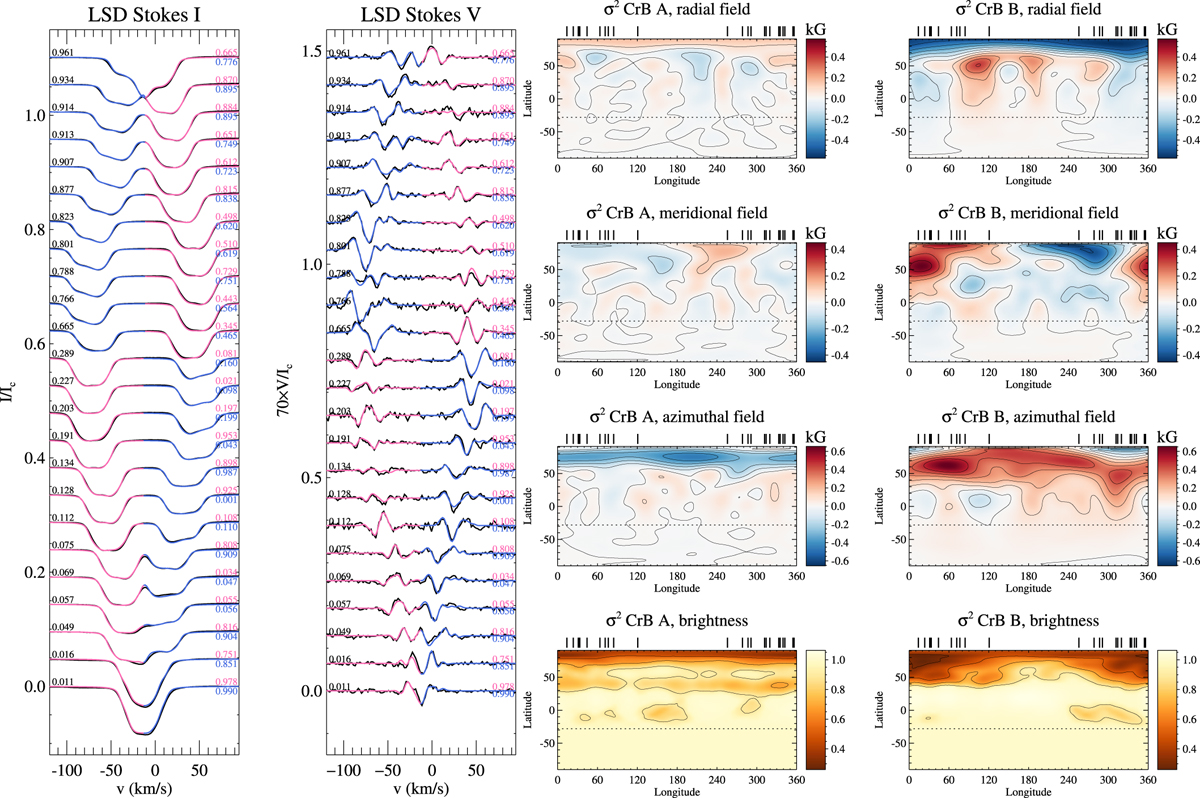
LSD Stokes IV line profiles and the reconstructed surface brightness and magnetic maps of σ2 CrB components for the 2014 epoch. The black (thin) lines represent the observed LSD profiles, the pink (thick) lines the corresponding model profiles of the primary, and the blue (thick) lines the model profiles of the secondary. The Stokes V profiles weremagnified by a factor of 70. The orbital phase is indicated in black to the left above each line profile and the individual rotation phases of the two components are indicated in pink and blue, respectively, to the right of each line profile. The left column of rectangular maps corresponds to the primary star while the right column shows the secondary. The contours in the magnetic maps are plotted with a step of 100 G and in the brightness maps with a step of 0.2 starting at 0.3. The horizontal dotted lines in the rectangular plots show the lowest visible latitude for the inclination angle of i = 28°. The black ticks above each rectangular map indicate orbital phases of observations. Longitude 0° of the primary is facing longitude 180° of the secondary.
Current usage metrics show cumulative count of Article Views (full-text article views including HTML views, PDF and ePub downloads, according to the available data) and Abstracts Views on Vision4Press platform.
Data correspond to usage on the plateform after 2015. The current usage metrics is available 48-96 hours after online publication and is updated daily on week days.
Initial download of the metrics may take a while.