Fig. 3
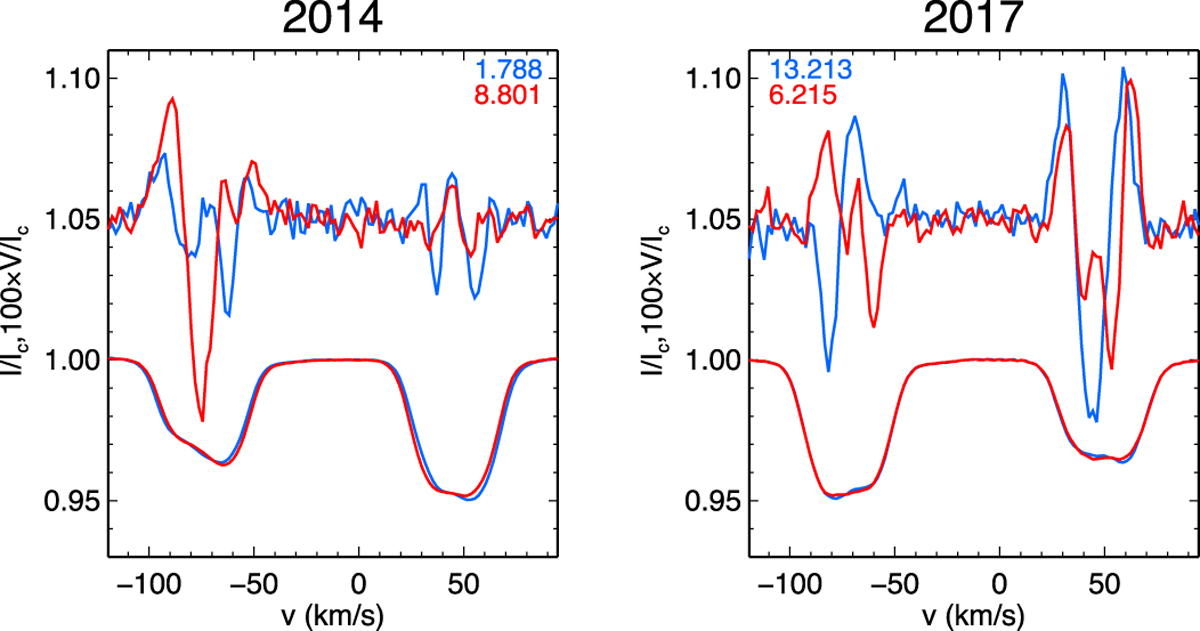
Comparison of the LSD Stokes IV profiles from close rotational phases at 2014 and 2017 observing epochs. The bottom profile of each figure shows the LSD Stokes I spectra. The upper profiles correspond to the LSD Stokes V spectra shifted vertically and magnified by a factor of 100. Each figure shows two observations in red and blue. The respective phases are indicated at the upper right and upper left corner of each panel.
Current usage metrics show cumulative count of Article Views (full-text article views including HTML views, PDF and ePub downloads, according to the available data) and Abstracts Views on Vision4Press platform.
Data correspond to usage on the plateform after 2015. The current usage metrics is available 48-96 hours after online publication and is updated daily on week days.
Initial download of the metrics may take a while.